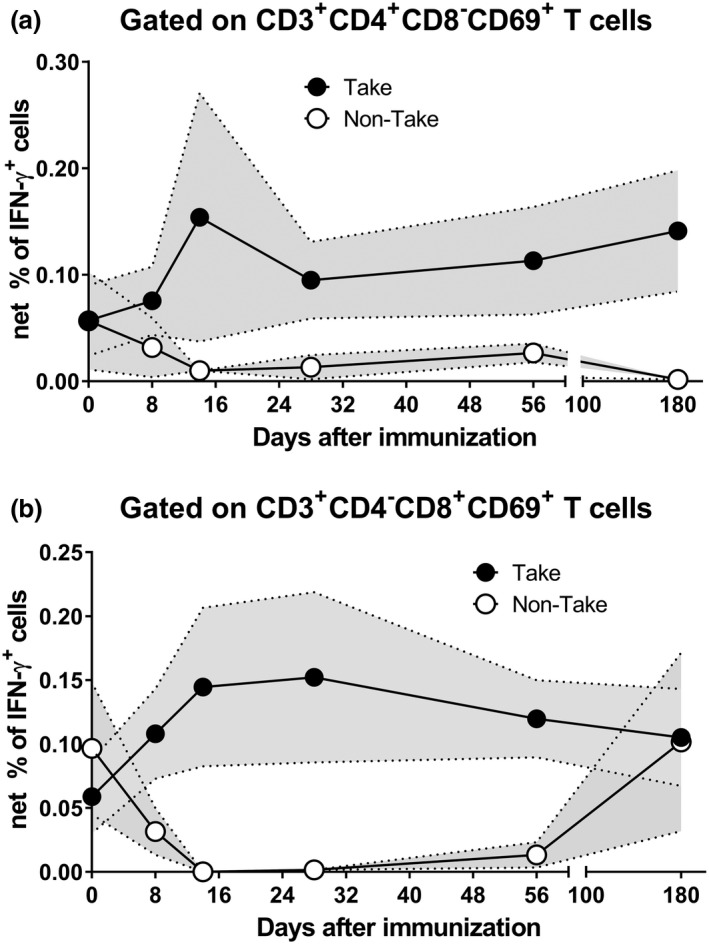
Figure 3.

Kinetics of F. tularensis‐specific T cells over 180 days after immunisation. Cells from 43 subjects at six time points, days 0, 8, 14, 28, 56 and 180, were stimulated with Schu‐S4 in the presence of CD107 ‘a’ and ‘b’ monoclonal antibodies. After an overnight incubation, PBMC were stained with ViViD, followed by surface staining with mAbs to CD3, CD4, CD8, CD14 and CD19. After fixation and permeabilisation, cells were stained intracellularly for CD69, as well as to IL‐2, IFN‐γ and TNF‐α cytokines and analysed by flow cytometry. IFN‐γ‐expressing CD4 (a) and CD8 (b) T cells are shown. Symbols represent the means, and the filled area denotes the standard error bands. Subjects were divided into two groups based on their take results: (1) take positive (Take) and (2) take negative (non‐Take). Per‐Protocol Population. Data are representative of 21 independent experiments with one replicate.
