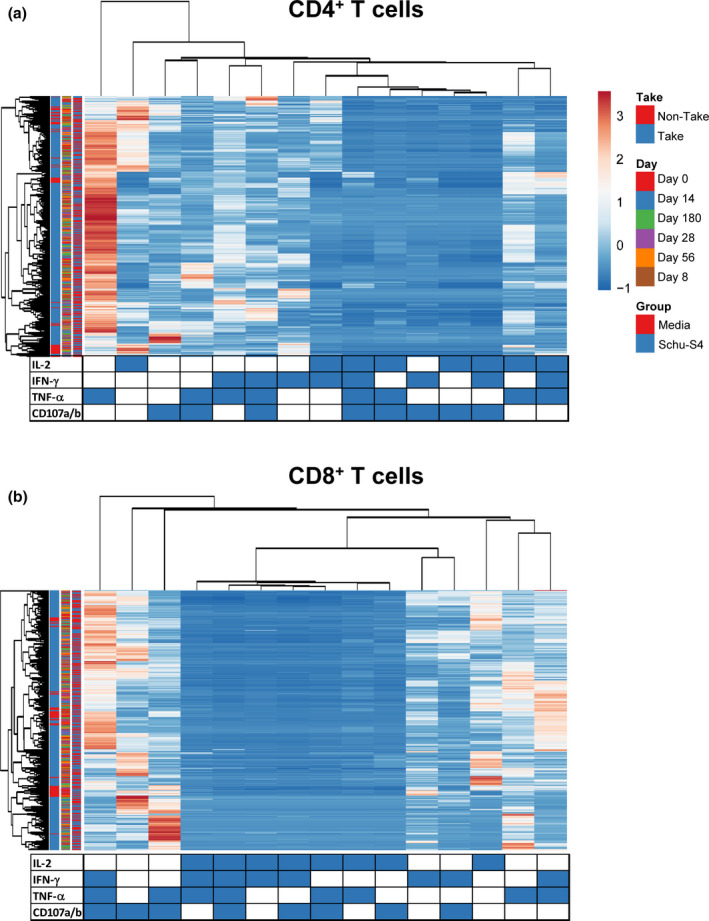
Figure 4.

Hierarchical clustering of T‐cell functions using principal component analysis (PCA). The four T‐cell functions (IL‐2, IFN‐γ, TNF‐α and CD107a/b expression) were analysed using the FCOM deconvolution tool. FCOM data of the 15 possible combinations were used to perform an unsupervised PCA analysis. PCA compared CD4 (a) and CD8 (b) T‐cell changes before and after exposure to Schu‐S4 at different time points (0, 8, 14, 28 56 and 180) in cells from individuals with (1) take positive (Take, n = 37) and (2) take negative (non‐Take, n = 6). Cells cultured with media only were used as controls (media). PCA was performed using the ClustVis web tool. Rows were centred, and unit variance scaling applied to rows. Rows were clustered using Euclidean distance and average linkage. Columns were clustered using correlation distance and average linkage. Trees ordering for both rows and columns display the tightest cluster first.
