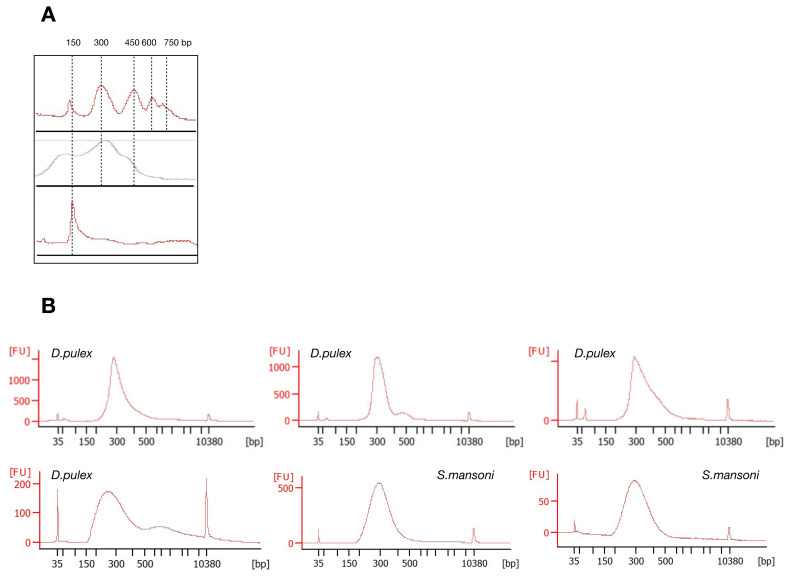
Figure 3.
Examples of fragmentation profiles of ATAC-seq libraries before ( A) and after size selection ( B). X-axis: Base pairs. Y-axis: Fluorescence intensity. ( A) Peaks correspond to nucleosome-free region, mono- to tetra-nucleosome fractions. Bottom lane: too strong fragmentation, thus Tn5 quantity needs to be decreased. ( B) Examples of BioAnalyser profiles of ATAC-seq libraries after size selection. Fragment size should be between 150 and 800 bp. Peaks at 35 bp and 10380 bp are spiked-in marker peaks for the BioAnalyser.

