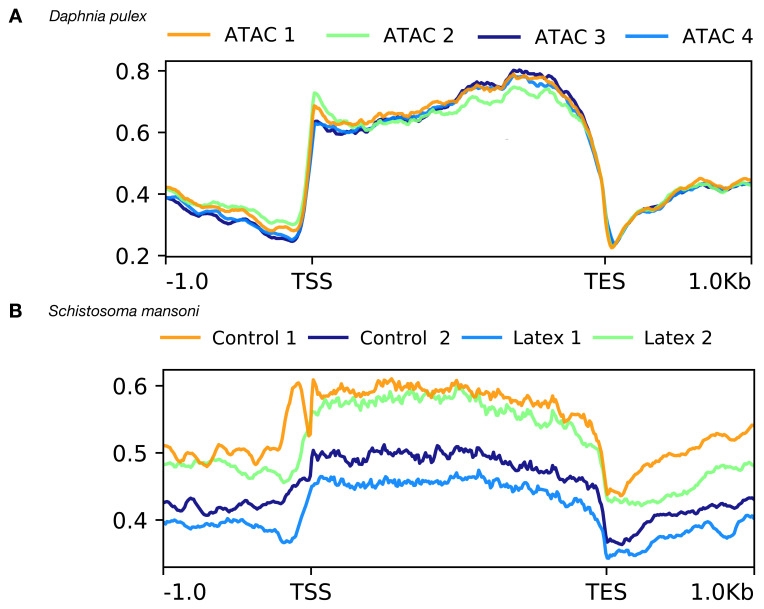
Figure 4. Superposed metagene ATAC profiles of four individuals after sequencing and analysis.
X-axis in base-pairs. TSS = Transcription start site, TES = transcription end site. Y-axis average enrichment of ATAC-seq reads over genes and upstream and downstream regions. Enrichment of accessible chromatin occurs along the entire length of the genes. The metagene profiles are almost identical for Daphnia ( A), while there is more heterogeneity of the profiles in schistosomes ( B). Nevertheless, the profiles are in both cases very reproducible indicating the robustness of the ATAC-seq procedure.

