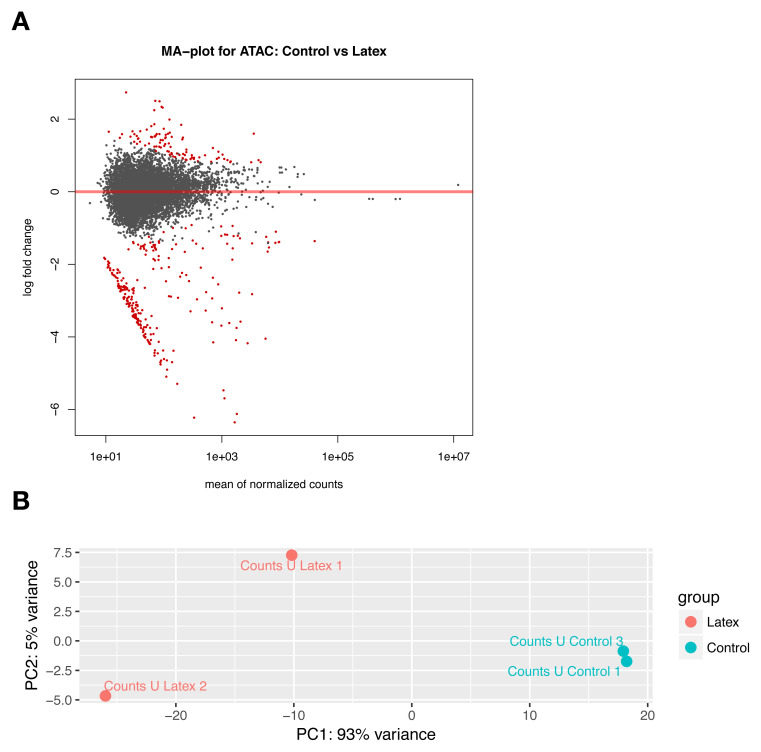
Figure 8.
( A) MA-Plot and ( B) Principal component analysis of individual schistosoma based on their ATAC-seq profiles. MA-plots are symmetric. Red dots indicate significantly different ATAC regions in control vs “Latex” population. On the PCA every point represents an individual male adult schistosome. Populations are colour coded. Samples from the control (blue) and “Latex” population (red) are well separated.

