Figure 6.
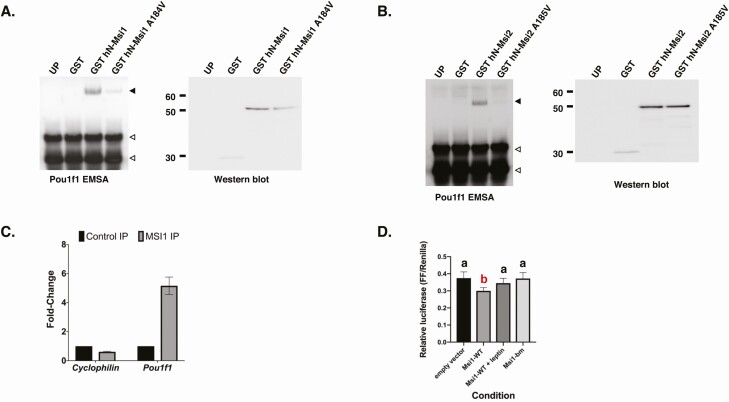
Musashi binding to the Pou1f1 3′ untranslated region (UTR) and translational control of reporter messenger RNAs (mRNAs) fused to the Pou1f1 3′ UTR. A, Left panel: RNA electrophoretic mobility shift assay (EMSA) using biotinylated Pou1f1 3′ UTR incubated with control unprogrammed reticulocyte lysate (UP) or reticulocyte lysate programmed to express glutathione S-transferase (GST), GST–N-terminal Musashi1 (hN-Msi1), or an RNA binding mutant form of Musashi1 (GST-hN_Msi1 A184V). The Musashi1-specific complex is indicated by a solid arrowhead; free probe is marked by open arrowheads. Right panel, Western blot of the reticulocyte lysates used in RNA EMSA detected through anti-GST antibodies to assess the relative expression level of the programmed proteins. The position of molecular weight standards (kDa) are shown. B, Right and left panels as described in A, but with reticulocytes programed with GST–N-terminal Musashi2 (hN-Msi2) or the RNA binding mutant of MSi2 (GST-hN-Msi2 A185V). The Musashi2-specific complex is indicated by a solid arrowhead, whereas a nonspecific band is indicated by an asterisk. C, Immunoprecipitation of whole-pituitary lysate from pooled control female mice. Results are expressed as fold-enrichment calculated from quantitative reverse-transcriptase–polymerase chain reaction of target mRNAs from control rabbit immunoglobulin or anti-Musashi1 immunoprecipitation p = 0.0456, n = 2, 1-tailed t-test. No enrichment of a control gene, Cyclophilin/peptidylprolyl isomerase A/cyclophilin (PPIA) was observed. D, NIH3T3 cells cotransfected with the pmiRGLO 552bp Pou1f1 3′ UTR Firefly Luciferase (FLuc) reporter plasmid and either peGFPN1 (encoding the eGFP moiety alone), peGFP Msi1 in the absence or presence of leptin (Msi1 + leptin) or control, peGFP Msi1-bm. FLuc values were normalized to the expression of a control Renilla luciferase expressed from the same plasmid (FF/Renilla). Summary graph of 4 separate experiments, in which each condition was measured in triplicate. Statistics: one-way analysis of variance (ANOVA) with Sidak multiple comparison test, F(3,44) = 15.4, P < .0001. Values that do not significantly differ from each other are represented by “a,” whereas “b” indicates a value that differs significantly after one-way ANOVA from all “a” values. Specifically, empty vector vs wild-type (WT) Msi1, P < .0001; WT Msi1 vs WT Msi1 + leptin, P < .004; and WT Msi1 vs Msi1-bm, P < .0001.

