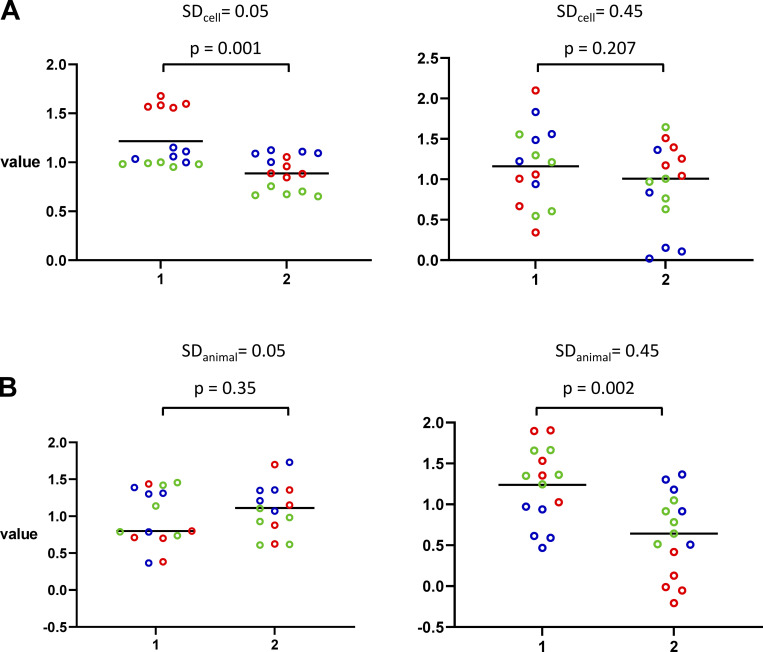
Figure 2.
Effects of animal and cell SD on apparent significance. (A) Effects of SDcell. In both panels, SDanimal is 0.3. SDcell is 0.05 (left) and 0.45 (right), giving P values of 0.001 and 0.207, respectively. (B) Effects of SDanimal. In both panels, SDcell is 0.3. SDanimal is 0.05 (left) and 0.45 (right), giving P values of 0.35 and 0.002, respectively. In both panels, the black horizontal lines denote the mean value of the 15 cells.

