Figure 2.
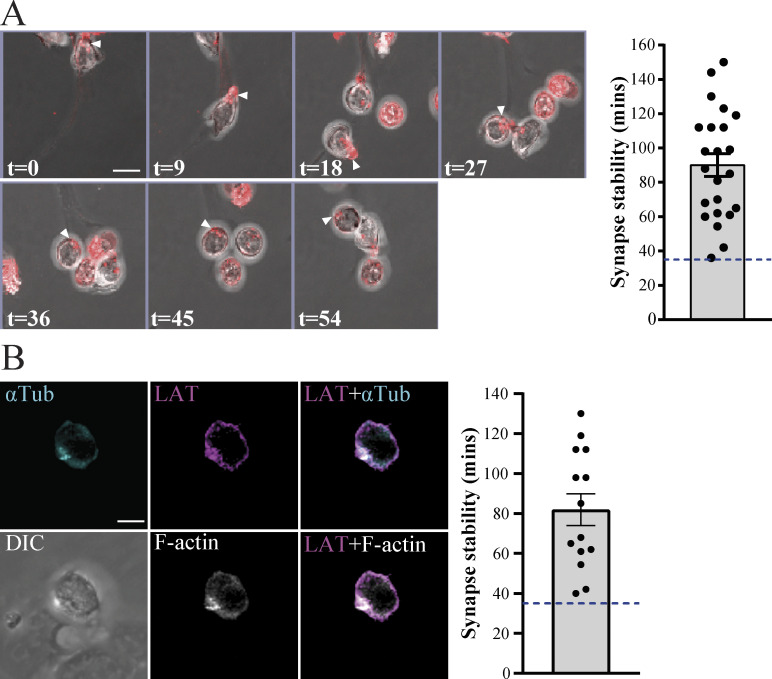
DN3a cells form a stable immunological synapse. (A) Sequential frames from time-lapse confocal microscopy of a DN3a cell docking onto OP9-DL1 cells (arrowheads indicate the cell of interest). F-actin (stained using SiR-F-actin dye) is shown in red and overlaid onto transmitted light images. Numbers on the bottom right of each panel indicate time in minutes. The entire movie is shown in Video 1. The scatter plot represents the time for which actin polarization was maintained at the interface upon docking of DN3a cells onto OP9-DL1 (each data point represents a single cell, total n = 22). (B) A single frame from time-lapse confocal microscopy of a DN3a cell docking onto OP9-DL1 (differential interference contrast [DIC]), showing polarization of α-tubulin (cyan), LAT (magenta), and F-actin (white). The entire movie is shown in Video 2. Scatter plot represents time periods in which α-tubulin (αTub), LAT, and F-actin polarized at the interface between DN3a and OP9-DL1 (each data point represents a single cell, total n = 14). Error bars (A and B) represent SEM.

