Figure 3.
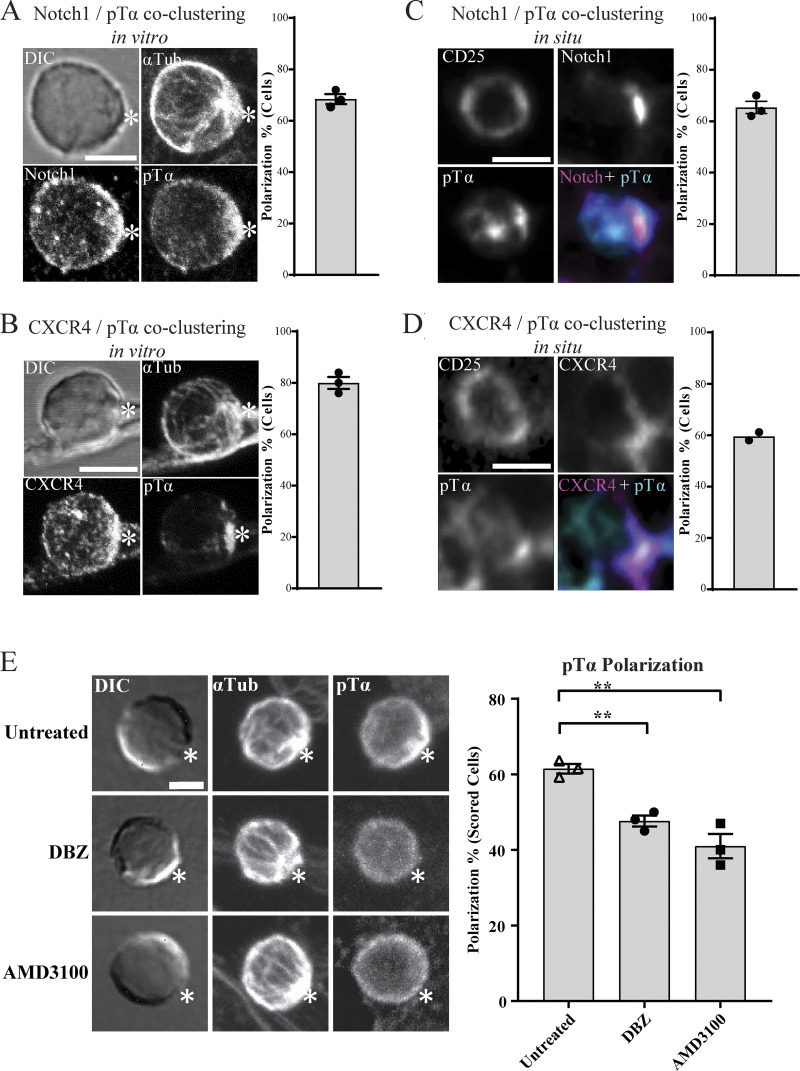
Notch and CXCR4 recruit pre-TCR components to the stromal interface. (A and B) DN3 cells were incubated with OP9-DL1 cells for 14 h and fixed and stained for α-tubulin to mark the MTOC, Notch1, CXCR4, and pTα chain (as shown). Z-stack images were acquired using confocal microscopy, and representative images are shown as maximum projection. Asterisks indicate the interface between DN3 cells and OP9-DL1 cells. After triaging for cells in which the MTOC was recruited to the interface with an OP9-DL1 cell, the percentage of cells in which the pTα chain was polarized with either Notch1 or CXCR4 to the interface with the OP9-DL1 cell was determined by blind scoring. The total number of scored conjugates per marker is 75 (25 cells per biological replicate). (C and D) DN3 cells in an intact thymus were stained for CD25 as a nonpolarized control, pTα as a marker for pre-TCR, and either Notch1 (C) or CXCR4 (D). Images were acquired using widefield fluorescent microscopy (Vectra 3 automated quantitative pathology imaging system), and representative images of Notch1-pTα (C) and CXCR4-pTα (D) coclustering in situ are shown. The total number of scored cells is 150 (C) or 100 (D). (E) DN3 cells were incubated with OP9-DL1 cells for 14 h in the presence or absence of either Notch inhibitor (DBZ) or CXCR4 inhibitor (AMD3100) and then fixed and stained for α-tubulin to mark the MTOC and pTα chain as a marker of pre-TCR (as shown). After triaging for cells in which the MTOC was recruited to the interface with an OP9-DL1 cell, the percentage of cells in which pTα was polarized to the interface with the OP9-DL1 cell was determined by blind scoring (as shown by column-bar plot). The total number of scored conjugates per condition is 75 (25 cells per biological replicate). Scale bars represent 5 µm (A and E) and 10 µm (C and D). Statistics by one-way ANOVA test. Untreated vs. DBZ: **, P = 0.019; untreated vs. AMD3100: **, P = 0.001. Error bars (A, B, C, D, and E) represent SEM.

