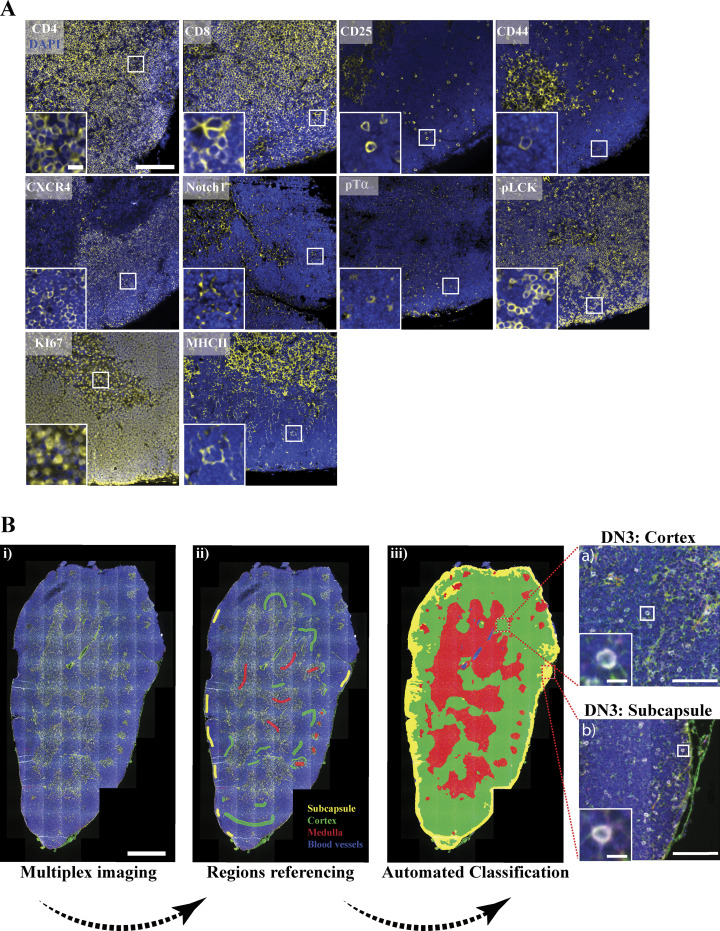
Figure 7.
Automated region classification of thymic lobes. (A) A thymus lobe slice of 4 µm thickness was stained and multiplex imaged using a 20× air objective. Each marker of the multiplex thymus panel was stained with TSA dye (yellow), followed by DAPI staining to mark the nucleus (blue). Images were acquired using widefield fluorescent microscopy (Vectra 3 automated quantitative pathology imaging system), and representative images are shown. (B) Thymus lobes were stained with a six-color multiplex panel. Images were spectrally dissected and then stitched together using HALO Indica Laboratories software. Random regions of the subcapsular (yellow), cortical (green), and medullary (red) regions and blood vessels (blue) were marked as reference regions and stored in the software library (ii). An automated classification of entire tissue using reference regions library was performed (iii). Using CD4, CD8, CD44, and CD25 surface expression with regions classification, we could identify DN3 cells in the cortex (top zoomed image) or subcapsule (bottom zoomed image). Scale bars represent 50 µm (A), 5 µm (A, zoomed image), 1 mm (Bi), 100 µm (Biii a and b, zoomed images) and 10 µm (a and b, zoomed images).

