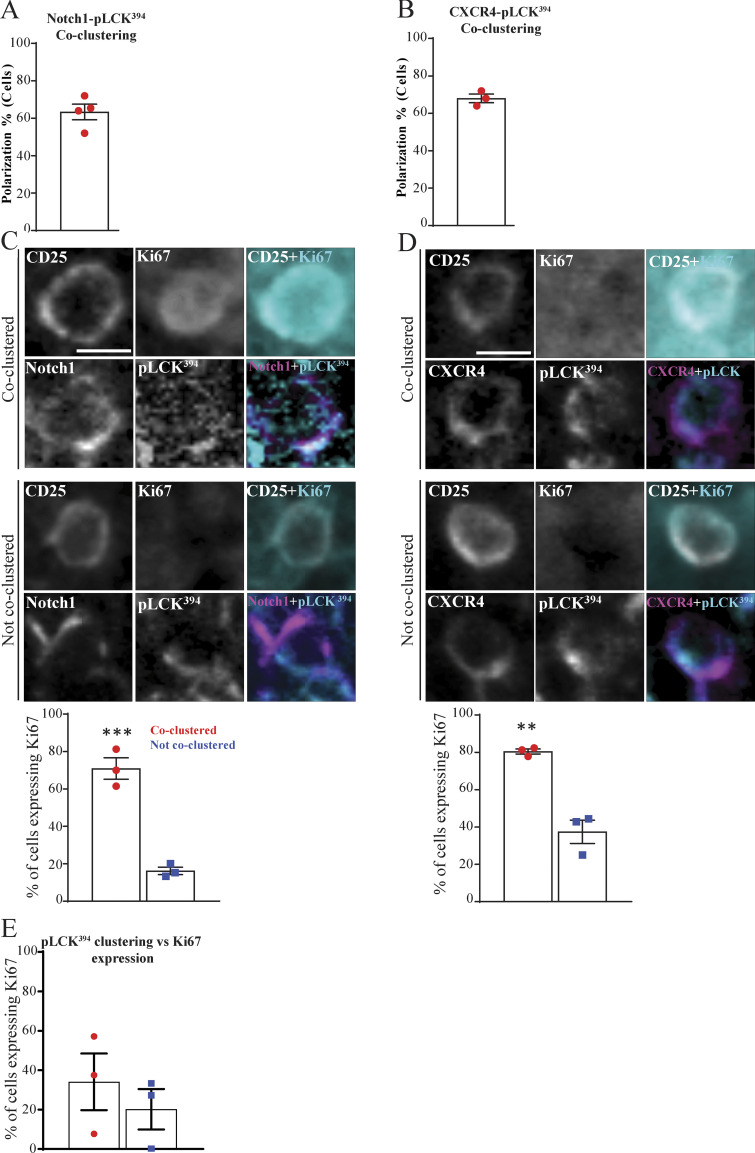
Figure 8.
The coassembly of Notch1, CXCR4, and pre-TCR into a single signaling platform is strongly associated with proliferation at the subcapsular zone in situ. (A and B) Multiplex imaging on sections of an intact thymus was performed, followed by automated tissue classification using HALO software. DN3 cells in the subcapsular zone were identified and analyzed for CD25 as a nonpolarized control. The percentages of cells showed coclustering of pLCK394 as a marker of pre-TCR signaling with either Notch1 (A) or CXCR4 (B) was determined as shown by the column-bar plots. The total number of scored cells is 100 (A) or 75 (B), with 25 cells per biological replicate. (C and D) DN3 cells were stained for CD25 as nonpolarizing control, pLCK394 as marker for pre-TCR downstream signaling, Ki67 as a proliferation marker, and either Notch1 or CXCR4. Images were acquired using widefield fluorescent microscopy (Vectra 3 automated quantitative pathology imaging system), and representative images of highly expressed Ki67 when Notch1 (C) or CXCR4 (D) coclusters with pLCK394 or a lack of Ki67 expression when Notch1 or CXCR4 does not cocluster with pLCK394 in situ are shown. DN3 cells with coclustering or no coclustering of pLCK394 with either Notch1 (C) or CXCR4 (D) in the subcapsular zone were assessed for levels of Ki67 expression, as shown by column-bar plots. The total number of scored cell is 75, with 25 cells per biological replicate. (E) DN3 cells in an intact thymic section were identified in the subcapsular zone, and the percentages of cells expressing the proliferation marker (Ki67) were assessed in cells showed clustering or no clustering of pLCK394, as shown by column-bar plots. The total number of scored cells is 75, with 25 cells per biological replicate. Scale bars, 10 µm. **, P = 0.0025; ***, P = 0.0008 (unpaired t test). Error bars (A, B, C, D, and E) represent SEM.

