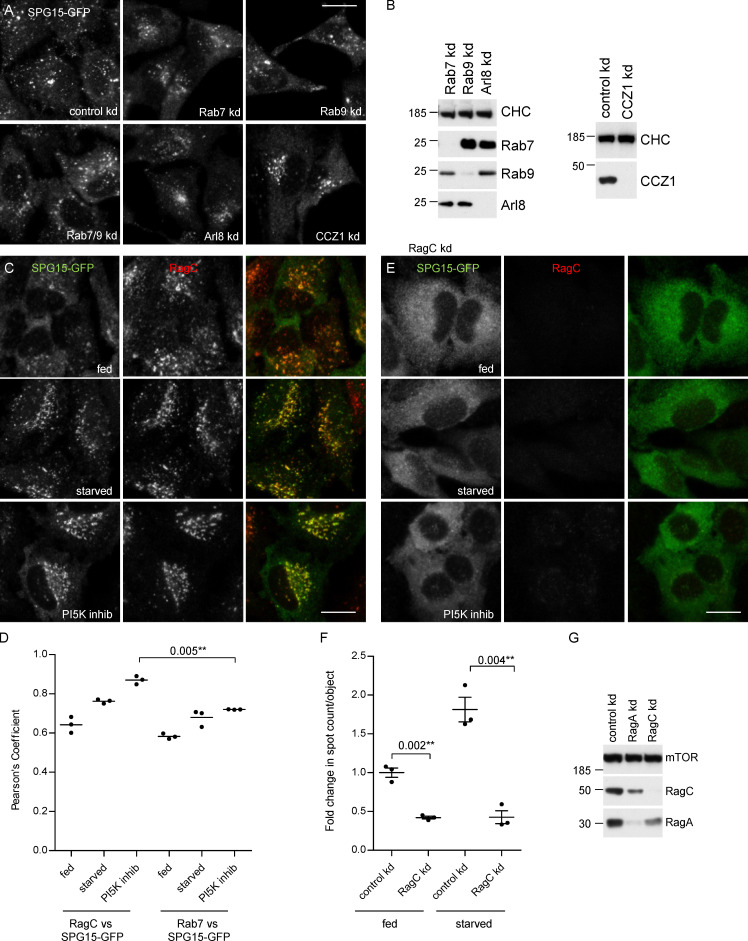
Figure 3.
Possible role for small GTPases. (A) IF labeling of SPG15-GFP, amplified with anti-GFP, in cells that had been treated with siRNA to knock down Rab7, Rab9, Rab7, and Rab9 together; Arl8; or the Rab7 GEF subunit CCZ1. This was compared with cells transfected with a nontargeting siRNA (control). To better visualize the labeling and any effects of siRNA depletion, all cells were starved for 1 h. None of these knockdowns had a significant effect on the membrane recruitment of SPG15-GFP, although, in some cases, there were effects on its localization (e.g., knocking down Arl8 results in a more perinuclear distribution, consistent with its known role in lysosome positioning; Pu et al., 2015). Scale bar: 20 µm. (B) Western blots of whole-cell lysates from SPG15-GFP cells treated with siRNAs as indicated. Clathrin heavy chain (CHC) was used as a loading control. (C) IF double labeling of SPG15-GFP (amplified with anti-GFP) and RagC, either under fed conditions, starved for 1 h, or treated with a PI5K inhibitor (1 µM YM201636; 1 h). Scale bar: 20 µm. (D) Quantification of the colocalization between SPG15-GFP and either RagC or Rab7, using Pearson’s correlation coefficient. The experiment was performed in biological triplicate (mean indicated; n = 3), and 20 cells were quantified per condition. Error bars represent SEM. (E) IF labeling of SPG15-GFP (amplified with anti-GFP) in cells that had been treated with siRNA to knock down RagC. Where indicated, cells were either starved (1 h) or treated with a PI5K inhibitor (1 µM YM201636; 1 h). The RagC knockdown caused the SPG15-GFP to become almost completely cytosolic. Scale bar: 20 µm. (F) Quantification of the fold change in spot count per object in SPG15-GFP–expressing cells that were treated with siRNA to knock down RagC or treated with a nontargeting siRNA. Where indicated, cells were incubated under fed or starved conditions (1 h). The experiment was performed in biological triplicate (mean indicated; n = 3), and 20 cells were quantified per condition. Error bars represent SEM. (G) Western blots of whole-cell lysates from SPG15-GFP cells treated with siRNAs as indicated; mTOR was used as a loading control. kd, knockdown.

