Figure 5.
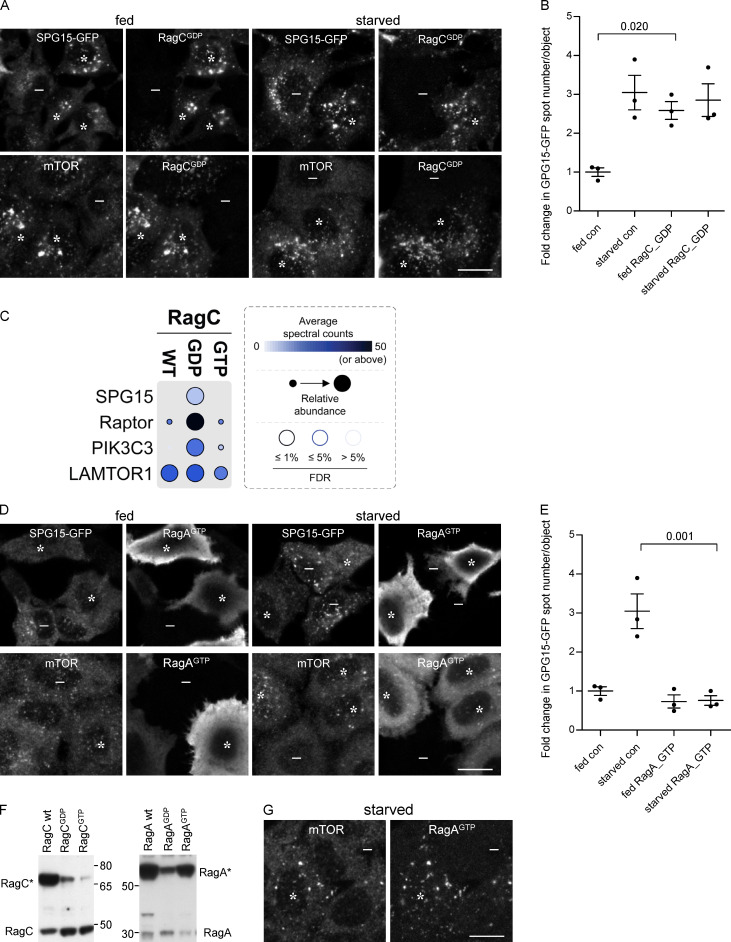
Recruitment of the complex is dependent on the Rag nucleotide loading status. (A) IF double labeling of either SPG15-GFP (amplified with anti-GFP) or mTOR in cells that had been transiently transfected with HA-GST–tagged RagC locked in its GDP-bound state. Where indicated, cells were incubated under fed or starved conditions (1 h). The RagCGDP causes enhanced recruitment of SPG15-GFP onto membranes in fed cells, and it also causes enhanced recruitment of mTOR in starved cells. RagCGDP-positive cells are marked with asterisks and negative cells with minus signs. Scale bar: 20 µm. (B) Quantification of the fold change in SPG15-GFP spot count per object in RagCGDP-expressing cells. The experiment was performed in biological triplicate (mean indicated; n = 3). Error bars represent SEM. (C) Dotplot (Knight et al., 2017) of BioID data with C-terminally BirA*-FLAG–tagged RagC (wild-type [WT], GDP-locked, and GTP-locked forms) in HEK293 cells (n.b., only selected proximity interactions are shown; see Table S1 for complete list of protein identifications [in the table, SPG15 is called ZFYVE26]). Dot color represents the abundance (average spectral counts; see inset legend) detected for the indicated prey protein (listed on left) across two biological replicates for the indicated BioID bait (listed on top). Dot outline indicates FDR of interaction as determined by SAINT. Relative abundance detected for given prey proteins across baits is indicated by dot size. (D) IF double labeling of either SPG15-GFP (amplified with anti-GFP) or mTOR in cells that had been transiently transfected with HA-GST–tagged RagA locked in its GTP-bound state. Where indicated, cells were incubated under fed or starved conditions (1 h). The RagAGTP prevents recruitment of SPG15-GFP onto membranes in starved cells but causes enhanced recruitment of mTOR in starved cells (RagAGTP-positive cells are marked with asterisks and negative cells with minus signs). Scale bar: 20 µm. (E) Quantification of the fold change in SPG15-GFP spot count per object in RagAGTP-expressing cells. The experiment was performed in biological triplicate (mean indicated; n = 3). Error bars represent SEM. (F) Western blots of whole-cell lysates from SPG15-GFP cells transiently transfected with HA-GST–tagged RagC or RagA constructs in either wild-type (wt), GDP-locked, or GTP-locked forms and labeled with antibodies against either RagA or RagC to compare expression levels with each other and with the endogenous proteins. Images are representative of two independent experiments. Note that HA-GST-RagA constructs are generally overexpressed relative to the endogenous protein, and RagCGTP is poorly expressed. (G) IF double labeling for mTOR in cells that had been transiently transfected with HA-GST–tagged RagA locked in its GTP-bound state. The cells were imaged 4 d rather than 2 d after transfection, so expression levels were more moderate. The strong effect on mTOR is still apparent. RagAGTP-positive cells are marked with asterisks and negative cells with minus signs. Scale bar: 20 µm. con, control.

