
Figure 2.
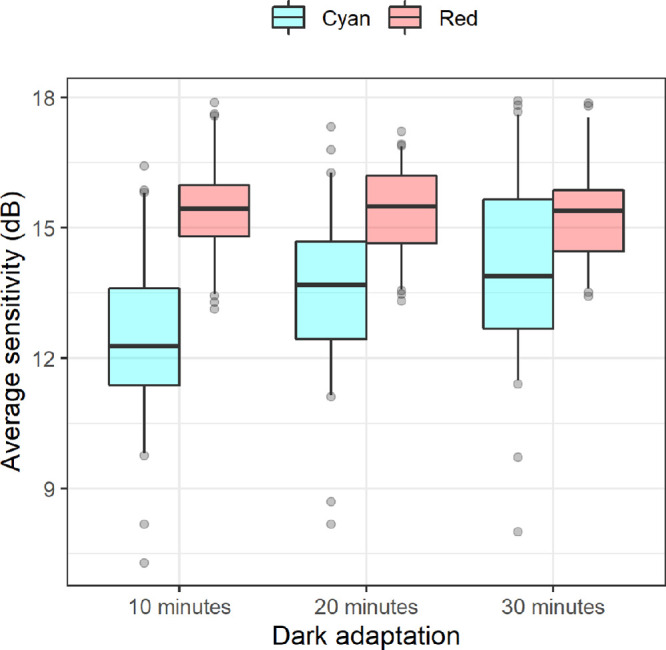
Box plots representing the average sensitivity for tests performed with different dark adaptation protocols. The boxes enclose the 25th to 75th percentiles, the whiskers extend from the 5th to the 95th percentiles.
Official websites use .gov
A
.gov website belongs to an official
government organization in the United States.
Secure .gov websites use HTTPS
A lock (
) or https:// means you've safely
connected to the .gov website. Share sensitive
information only on official, secure websites.
Box plots representing the average sensitivity for tests performed with different dark adaptation protocols. The boxes enclose the 25th to 75th percentiles, the whiskers extend from the 5th to the 95th percentiles.