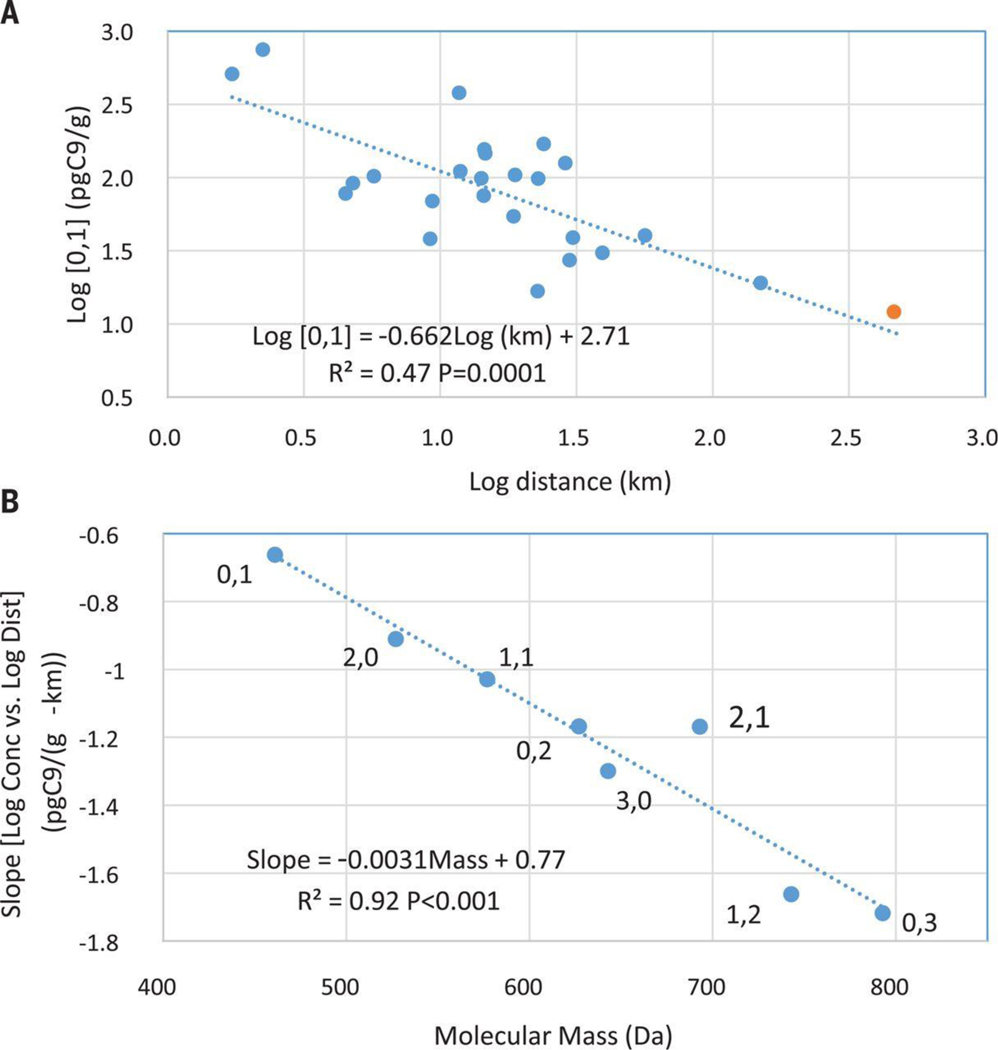
Fig. 3A:
Log 0,1-congener soil concentration (pg/g) vs log distance from Solvay (km). The regression statistics are for the NJ soil samples (blue) located as far as 150 km removed from Solvay (Table S1). Other ClPFPECA congeners are still more highly correlated with distance from Solvay (Table 1). Also shown is the 0,1 congener detected in a soil from Merrimack, NH at 12.1 pg/g (orange), some 460 km distant from Solvay (Table S1), falling closely proximate to the regression line for NJ 0,1 congeners. The 0,1 congener is the most-widely dispersed of the ClPFPECAs (Fig. 3B) and the only ClPFPECA detected in the NH soil. Inclusion of the NH data point in the regression (R2=0.55; P=10−5) increases the significance of the relationship roughly an order of magnitude beyond that of NJ data alone. 3B: Regression slope (log [ClPFPECA] vs log distance from Solvay) for each of eight ClPFPECA congeners vs congener molecular mass. Given the statistically significant relationship (P=0.001), this observation suggests sorting by molecular mass in an atmospheric plume, with lighter molecules generally being dispersed more remotely than heavier molecules. Mechanisms of atmospheric mass sorting remain uncertain, but regression slope also is correlated with congener-acid vapor pressure (R2=0.91; P<0.001) and congener-anion octanol-water partition coefficient (R2=0.92; P<0.001) as estimated by the USEPA Chemical Transformation Simulator (25).

