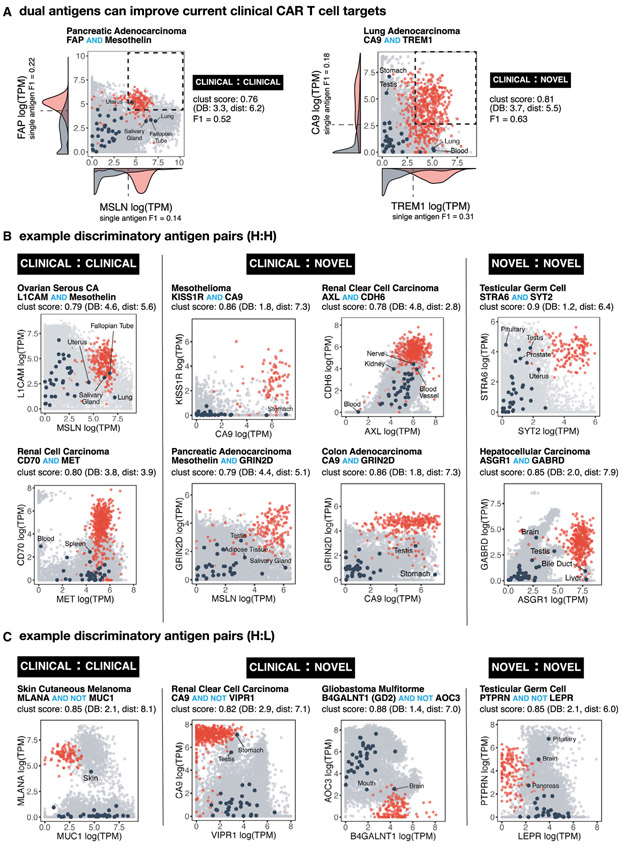
Figure 3. Numerous Potential Antigen Pairs Show Significant Improvement in the Precision of Tumor Recognition.
(A) Examples of antigen pairs with improved tumor-versus-normal discrimination by switching from single to dual antigen recognition. 2D plots show expression level of both antigens in normal tissue samples (gray) versus specific cancer-type samples (red). Navy circles show centroids for each of the normal tissue types (labeled when close to red cancer cluster). Pairs were scored by clustering as well as by F1 score. Density function of single antigen expression in tumor (red) and normal (gray) tissue are plotted on respective axis, including an optimal point of discrimination showing the best potential tumor-versus-normal discrimination using a single antigen.
(B) Example 2D plots as in (A) highlighting potential AND gates that combine known CAR target pairs (clinical-clinical), known CAR targets paired with new potential antigens (clinical-novel), and pairs of new potential targets (novel-novel).
(C) Example 2D plots as in (B) highlighting potential NOT gates.

