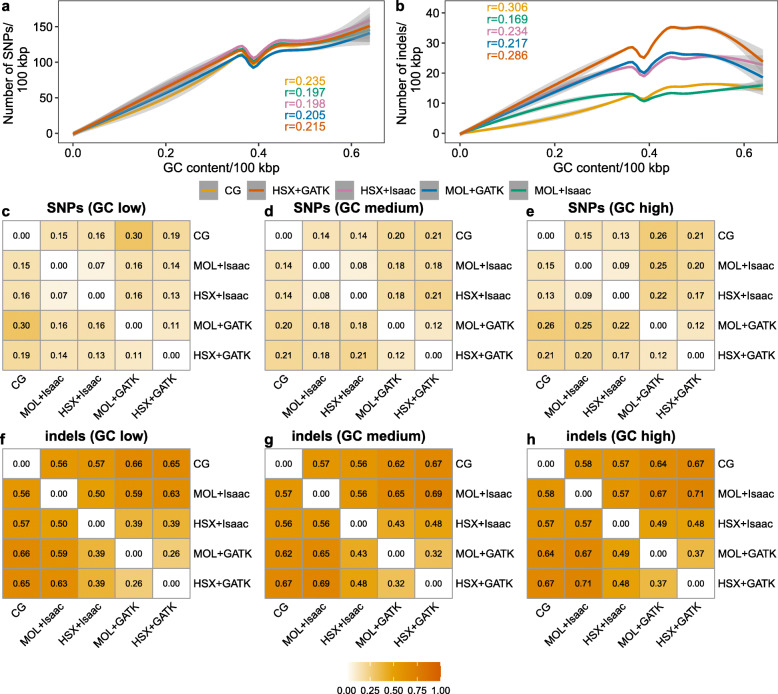
Fig. 5.
Relationship between GC content, number of variants, and concordance of variant calls between experimental setups. The correlation between GC content and the number of SNPs (a) and indels (b) based on genomic bins of 100 kbp was evaluated with the Spearman correlation coefficient r. Regression lines were fitted using generalized additive models. The correlation was highly significant for all setups (p < 2 × 10− 16). Heatmaps show the concordance between different experimental setups for SNPs (c, d, e) and indels (f, g, h) in genomic regions with low (< 37%), medium (between 37 and 47%), and high (> 47%) GC content. Values correspond to the Jaccard distance, which ranges between 0 and 1. Higher values indicate decreased concordance between the respective experimental setups. CG: Complete Genomics; MOL: Illumina HiSeq; HSX: Illumina HiSeq X

