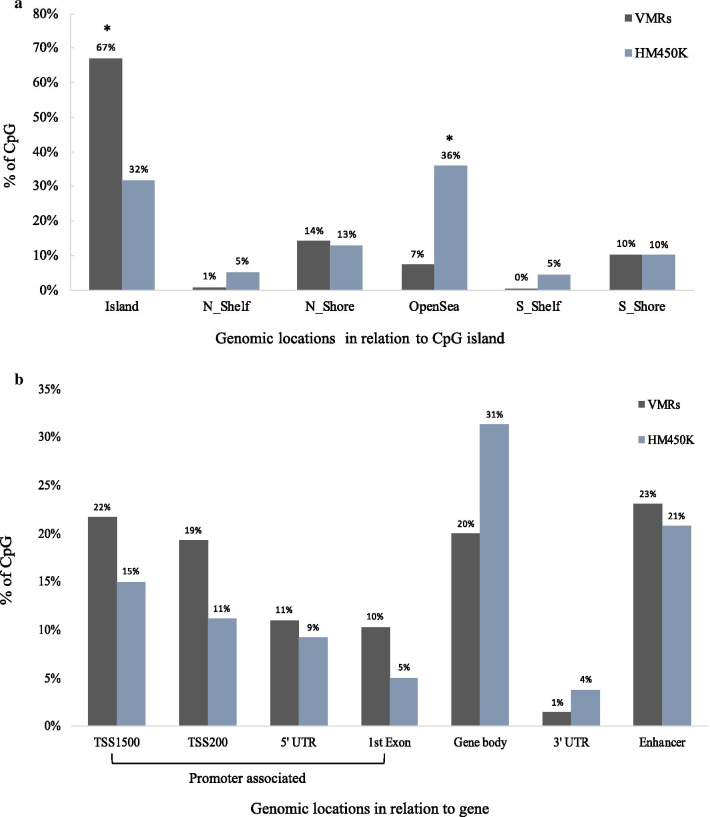
Fig. 2.
Genomic distribution of the variably methylated regions (VMRs). Bar plots show the distribution of 2771 variably methylated regions (VMRs) identified within invasive lobular breast cancer (ILBC) samples in the Melbourne Collaborative Cohort Study (MCCS) a relative to CpG islands, shores (0–2 kb from island), shelves (2–4 kb from island) and open sea and b in relation to the gene. Different genomic locations are shown on the x-axis and the percentage of CpG positions related to the VMRs is shown on the y-axis. The distribution of the HM450K probes relative to each CpG context is also indicated. P-values (Chi-square test) assessing significant enrichment in a given category relative to the HM450K array composition are indicated (*P < 0.001)

