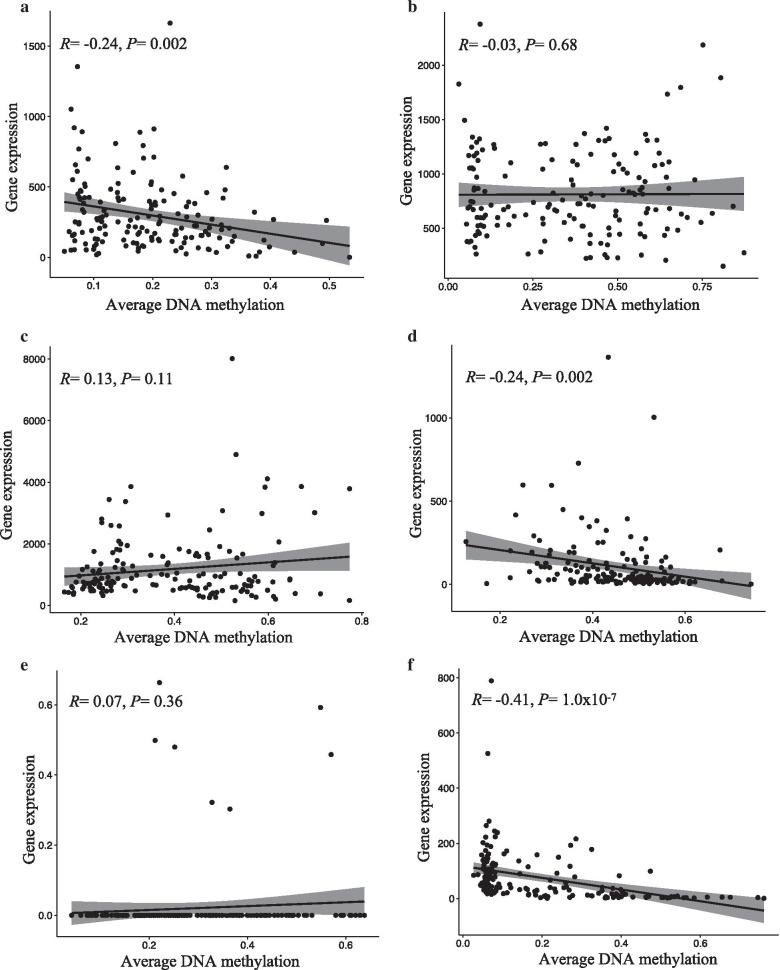
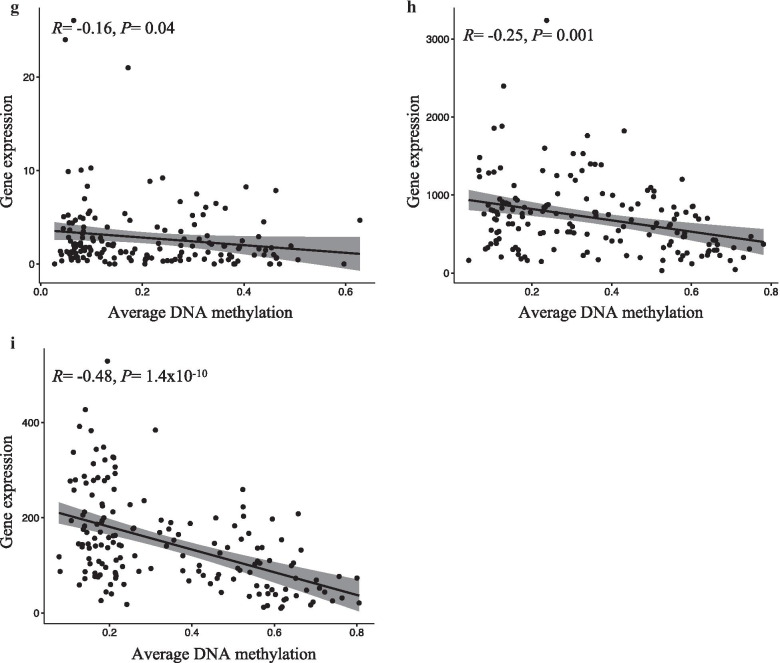
Fig. 4.
Correlation between methylation levels and gene expression. The graphics show the correlation between average DNA methylation (on the x-axis) and gene expression (on the y-axis) levels of invasive lobular breast cancer (ILBC) cases at the corresponding genes associated with nine of ten strongest variably methylated regions (VMRs) with available gene expression data in The Cancer Genome Atlas (TCGA) in the invasive lobular breast cancer (ILBC) cases in TCGA dataset: a ISM1, b APC, c TMEM101, d ASCL2, e NKX6, f HIST3H2A, g HES5, h CELF2, i EFCAB4B


