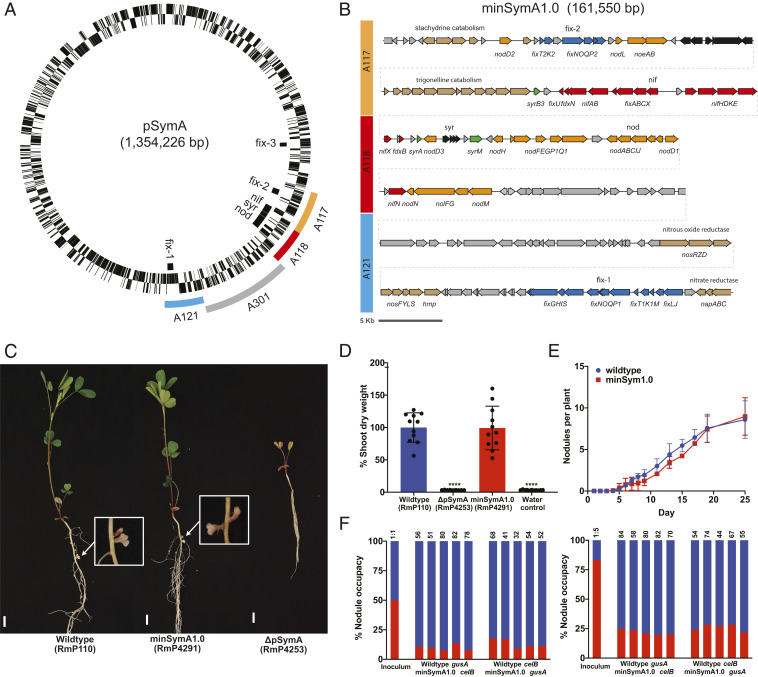
Fig. 1.
Isolation of the minimal symbiotic genome, minSymA1.0. (A) Circular map of the symbiotic megaplasmid pSymA from S. meliloti 1021 with symbiotic loci indicated inside the circle. The three essential symbiotic regions (A117, A118, and A121) as defined in diCenzo et al. (16) are colored outside the circle. The gray A301 region was deleted in order to bring the three essential symbiotic regions adjacent to one another. (B) Map of minSymA1.0 containing the A117, A118, and A121 symbiotic regions. Open reading frames (ORFs) and characterized genes are shown. Gene cluster names correspond to the locus designations in A. ORFs are colored according to their function as follows: orange—NF production and regulation, and nodulation efficiency; red—nitrogenase synthesis, assembly, electron supply, and regulation; blue—high-affinity terminal oxidase synthesis, assembly, and regulation; green—syr-associated transcriptional regulation; brown—other characterized metabolic genes not associated directly with SNF; gray—uncharacterized ORFs. (C) Images of alfalfa plants and nodules 31 d following inoculation with wild type, minSymA1.0, and ΔpSymA strains. (Scale bars, 1 cm.) (D) Relative shoot dry weight of M. sativa plants 35 to 38 d post inoculation. Wild type and minSymA1.0 were not significantly different in a one-way ANOVA and Dunnett’s multiple comparisons test (P = 0.9995); ****P < 0.0001 indicates significant difference from wild type. Each data point represents one independent replicate and is calculated from the average shoot dry weight in one pot (six plants per pot). (E) Kinetics of nodule formation on alfalfa for wild type compared to minSymA1.0. Data are the average of two independent experiments with 16 plants per experiment. (F) Competitiveness of minSymA1.0 (red) for nodule occupancy when coinoculated with wild type (blue). Data are presented from 10 pots including reversal of the marker gusA and celB genes as indicated. Plants were inoculated at a ratio of 50% minSymA1.0 (Left) and 80% minSymA1.0 (Right). Total number of nodules examined are indicated above each bar.

