Fig. 3.
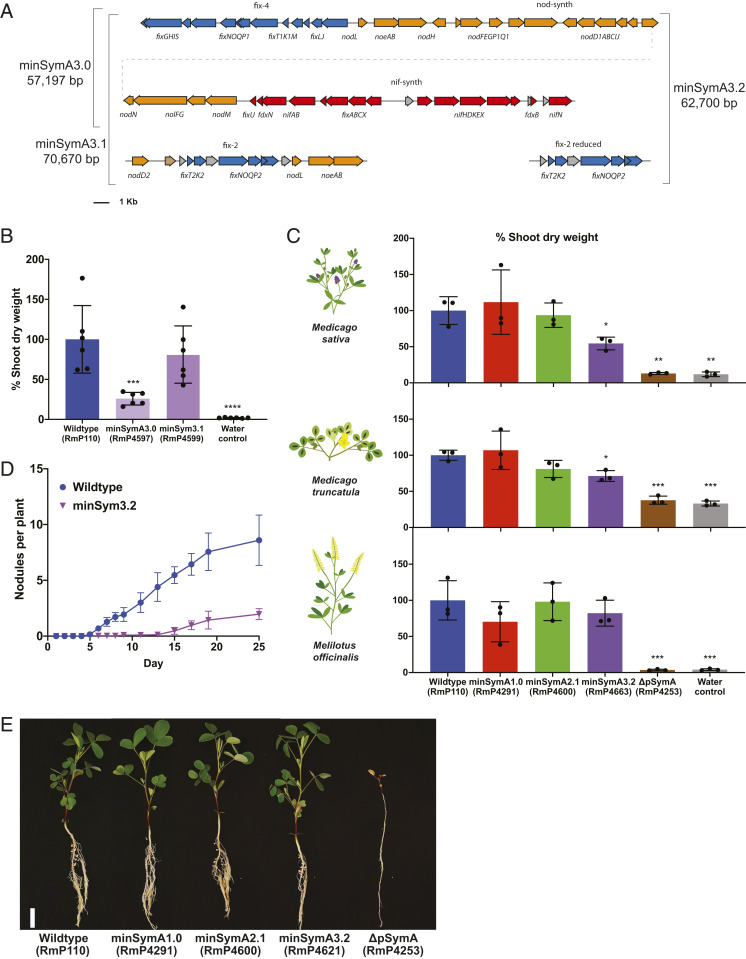
Functionalization and simplification of the minimal symbiotic genome. (A) Map of the gene contents of minSymA3.0, minSymA3.1, and minSymA3.2. Genes are represented as arrows. Annotations and coloring are as described in Fig. 1B. (B) Shoot dry weight of alfalfa plants inoculated by minSymA3.0 and minSymA3.1 (38 d post inoculation). (C) Comparison of shoot dry weight of three different legume hosts inoculated with wild type, minSymA1.0, minSymA2.1, or minSymA3.2 (31 d post inoculation). For B and C, each data point represents one independent replicate and is calculated from the average shoot dry weight in one pot (six plants per pot for M. sativa and four plants per pot for M. truncatula and M. officinalis). (D) Kinetics of nodule formation on alfalfa inoculated with minSymA3.2 compared to wild type. (E) Images of M. officinalis plants inoculated with S. meliloti minSymA strains (31 d post inoculation). (Scale bar, 2 cm.) Data are the average of two independent experiments with 16 plants per experiment. For shoot dry-weight assays, statistical significance was assessed with one-way ANOVA and Dunnett’s multiple comparisons test and is presented compared to wild type. *P < 0.1, **P < 0.01, ***P < 0.001, ****P < 0.0001.

