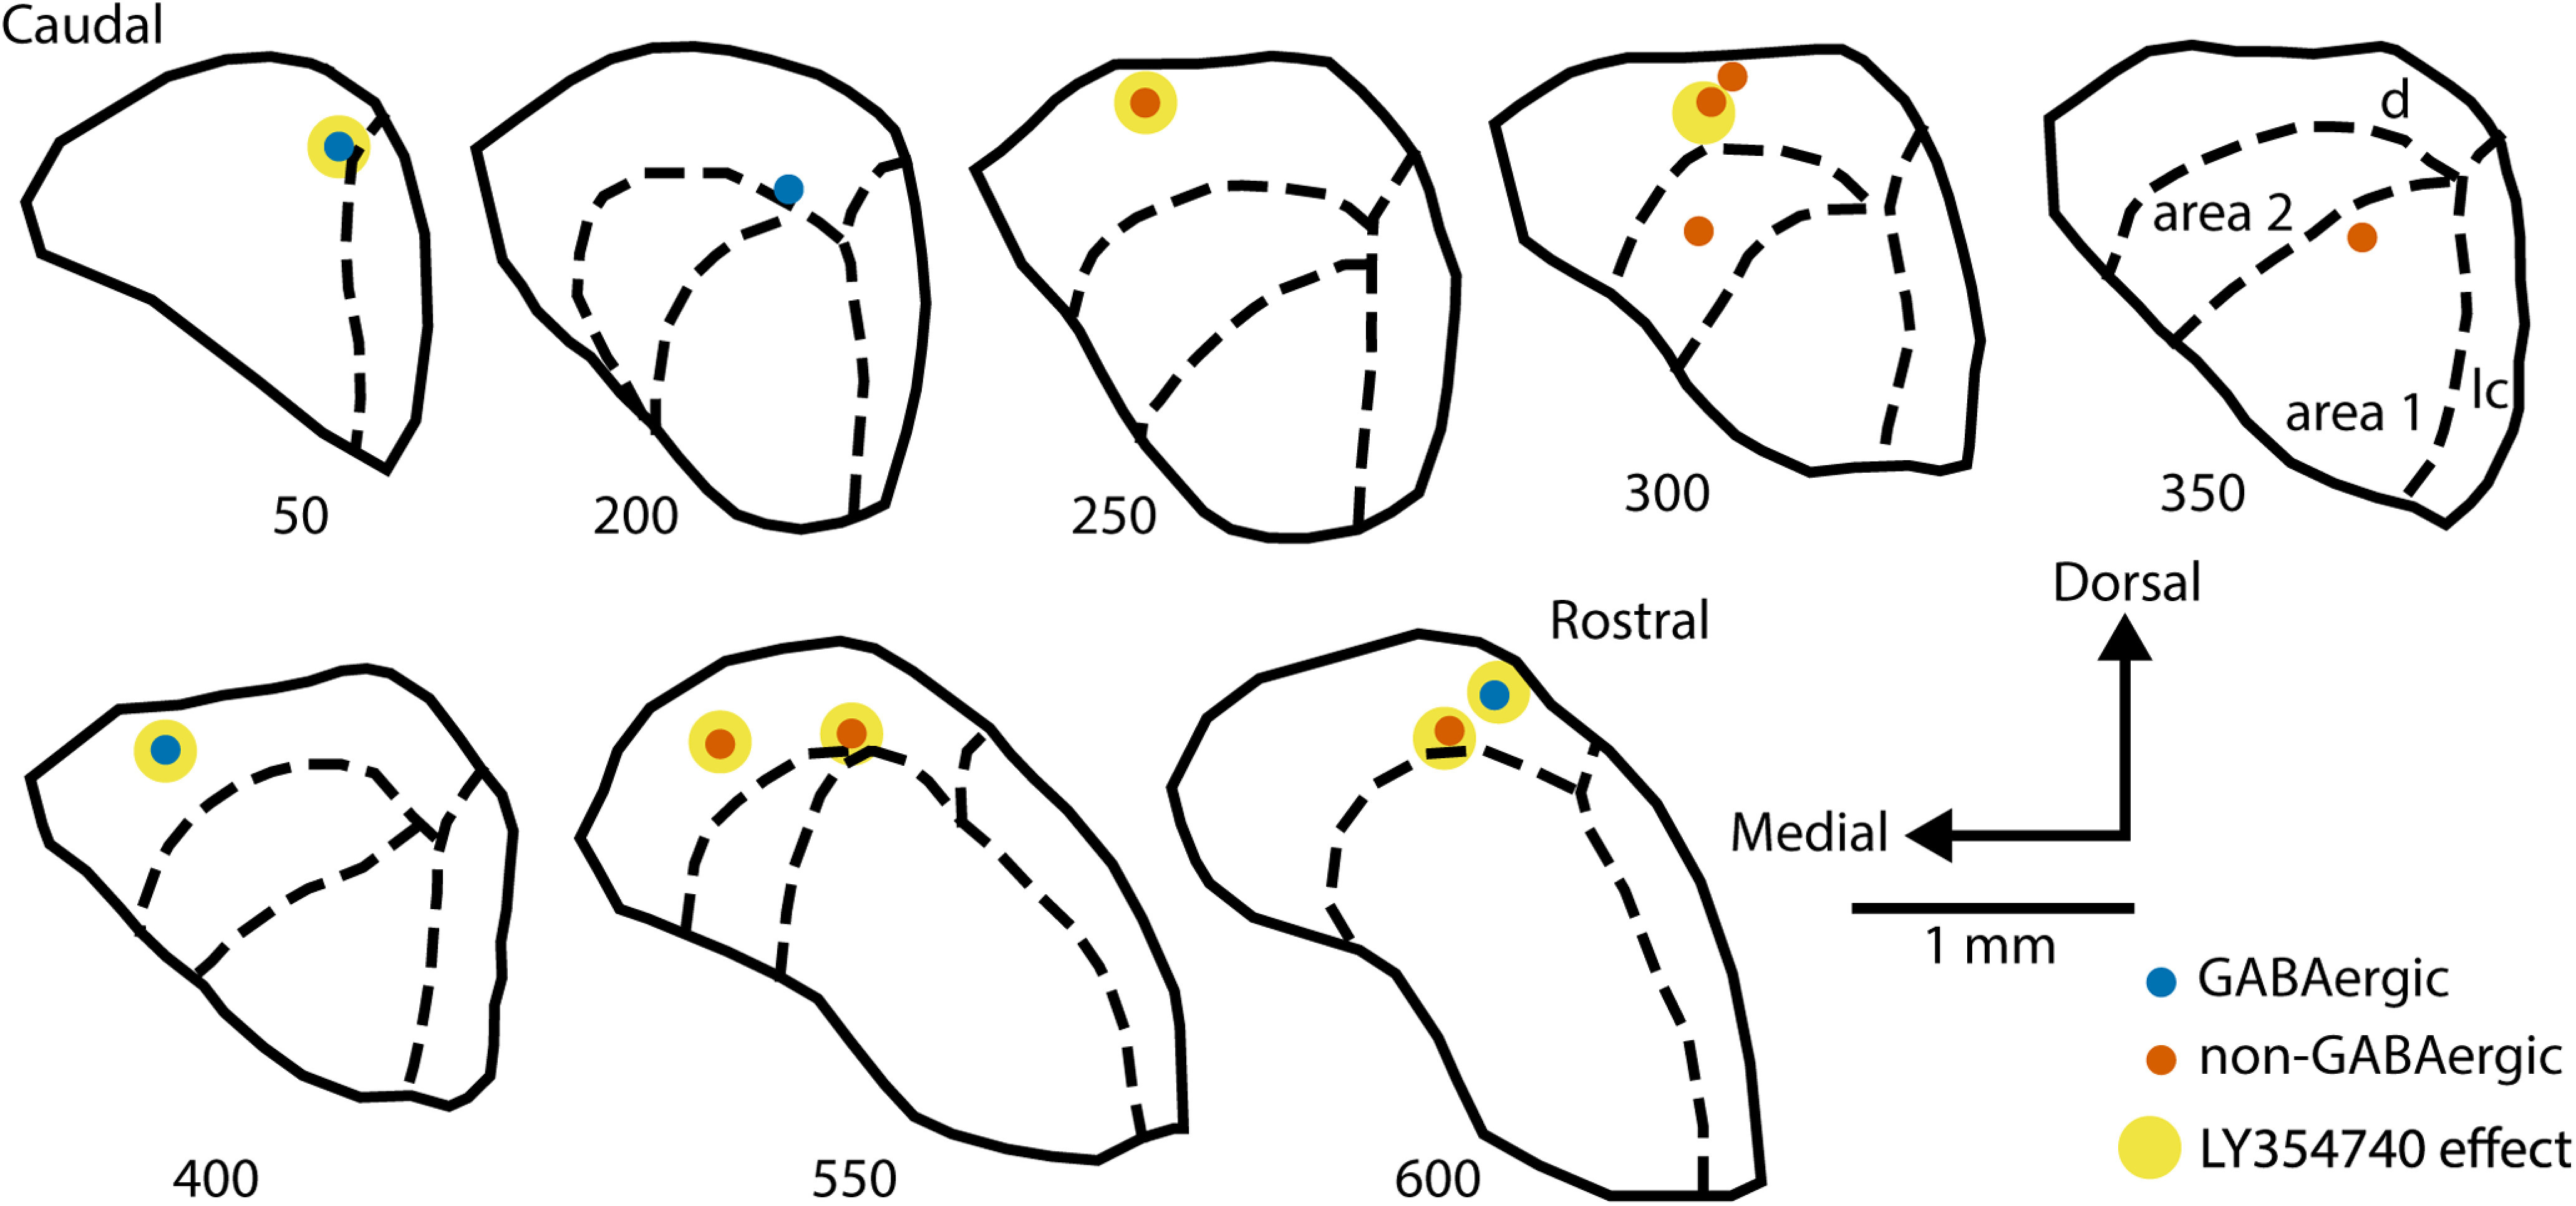
Figure 10.

Successfully identified recording sites plotted on the schematic IC sections arranged from caudal to rostral. Numbers under each section indicate the approximate distance in μm from the caudal surface of the IC. Dashed lines indicate the boundaries of IC subregions: parts of the central IC nucleus, area 1 and area 2, as well as dorsal (d) and lateral (l) cortex (subdivisions are labeled only in the section at 350 μm from the most caudal IC part). GABAergic neurons are marked with blue dots, non-GABAergic with orange dots. The dots additionally marked with yellow indicate neurons assigned to the drug effect group.
