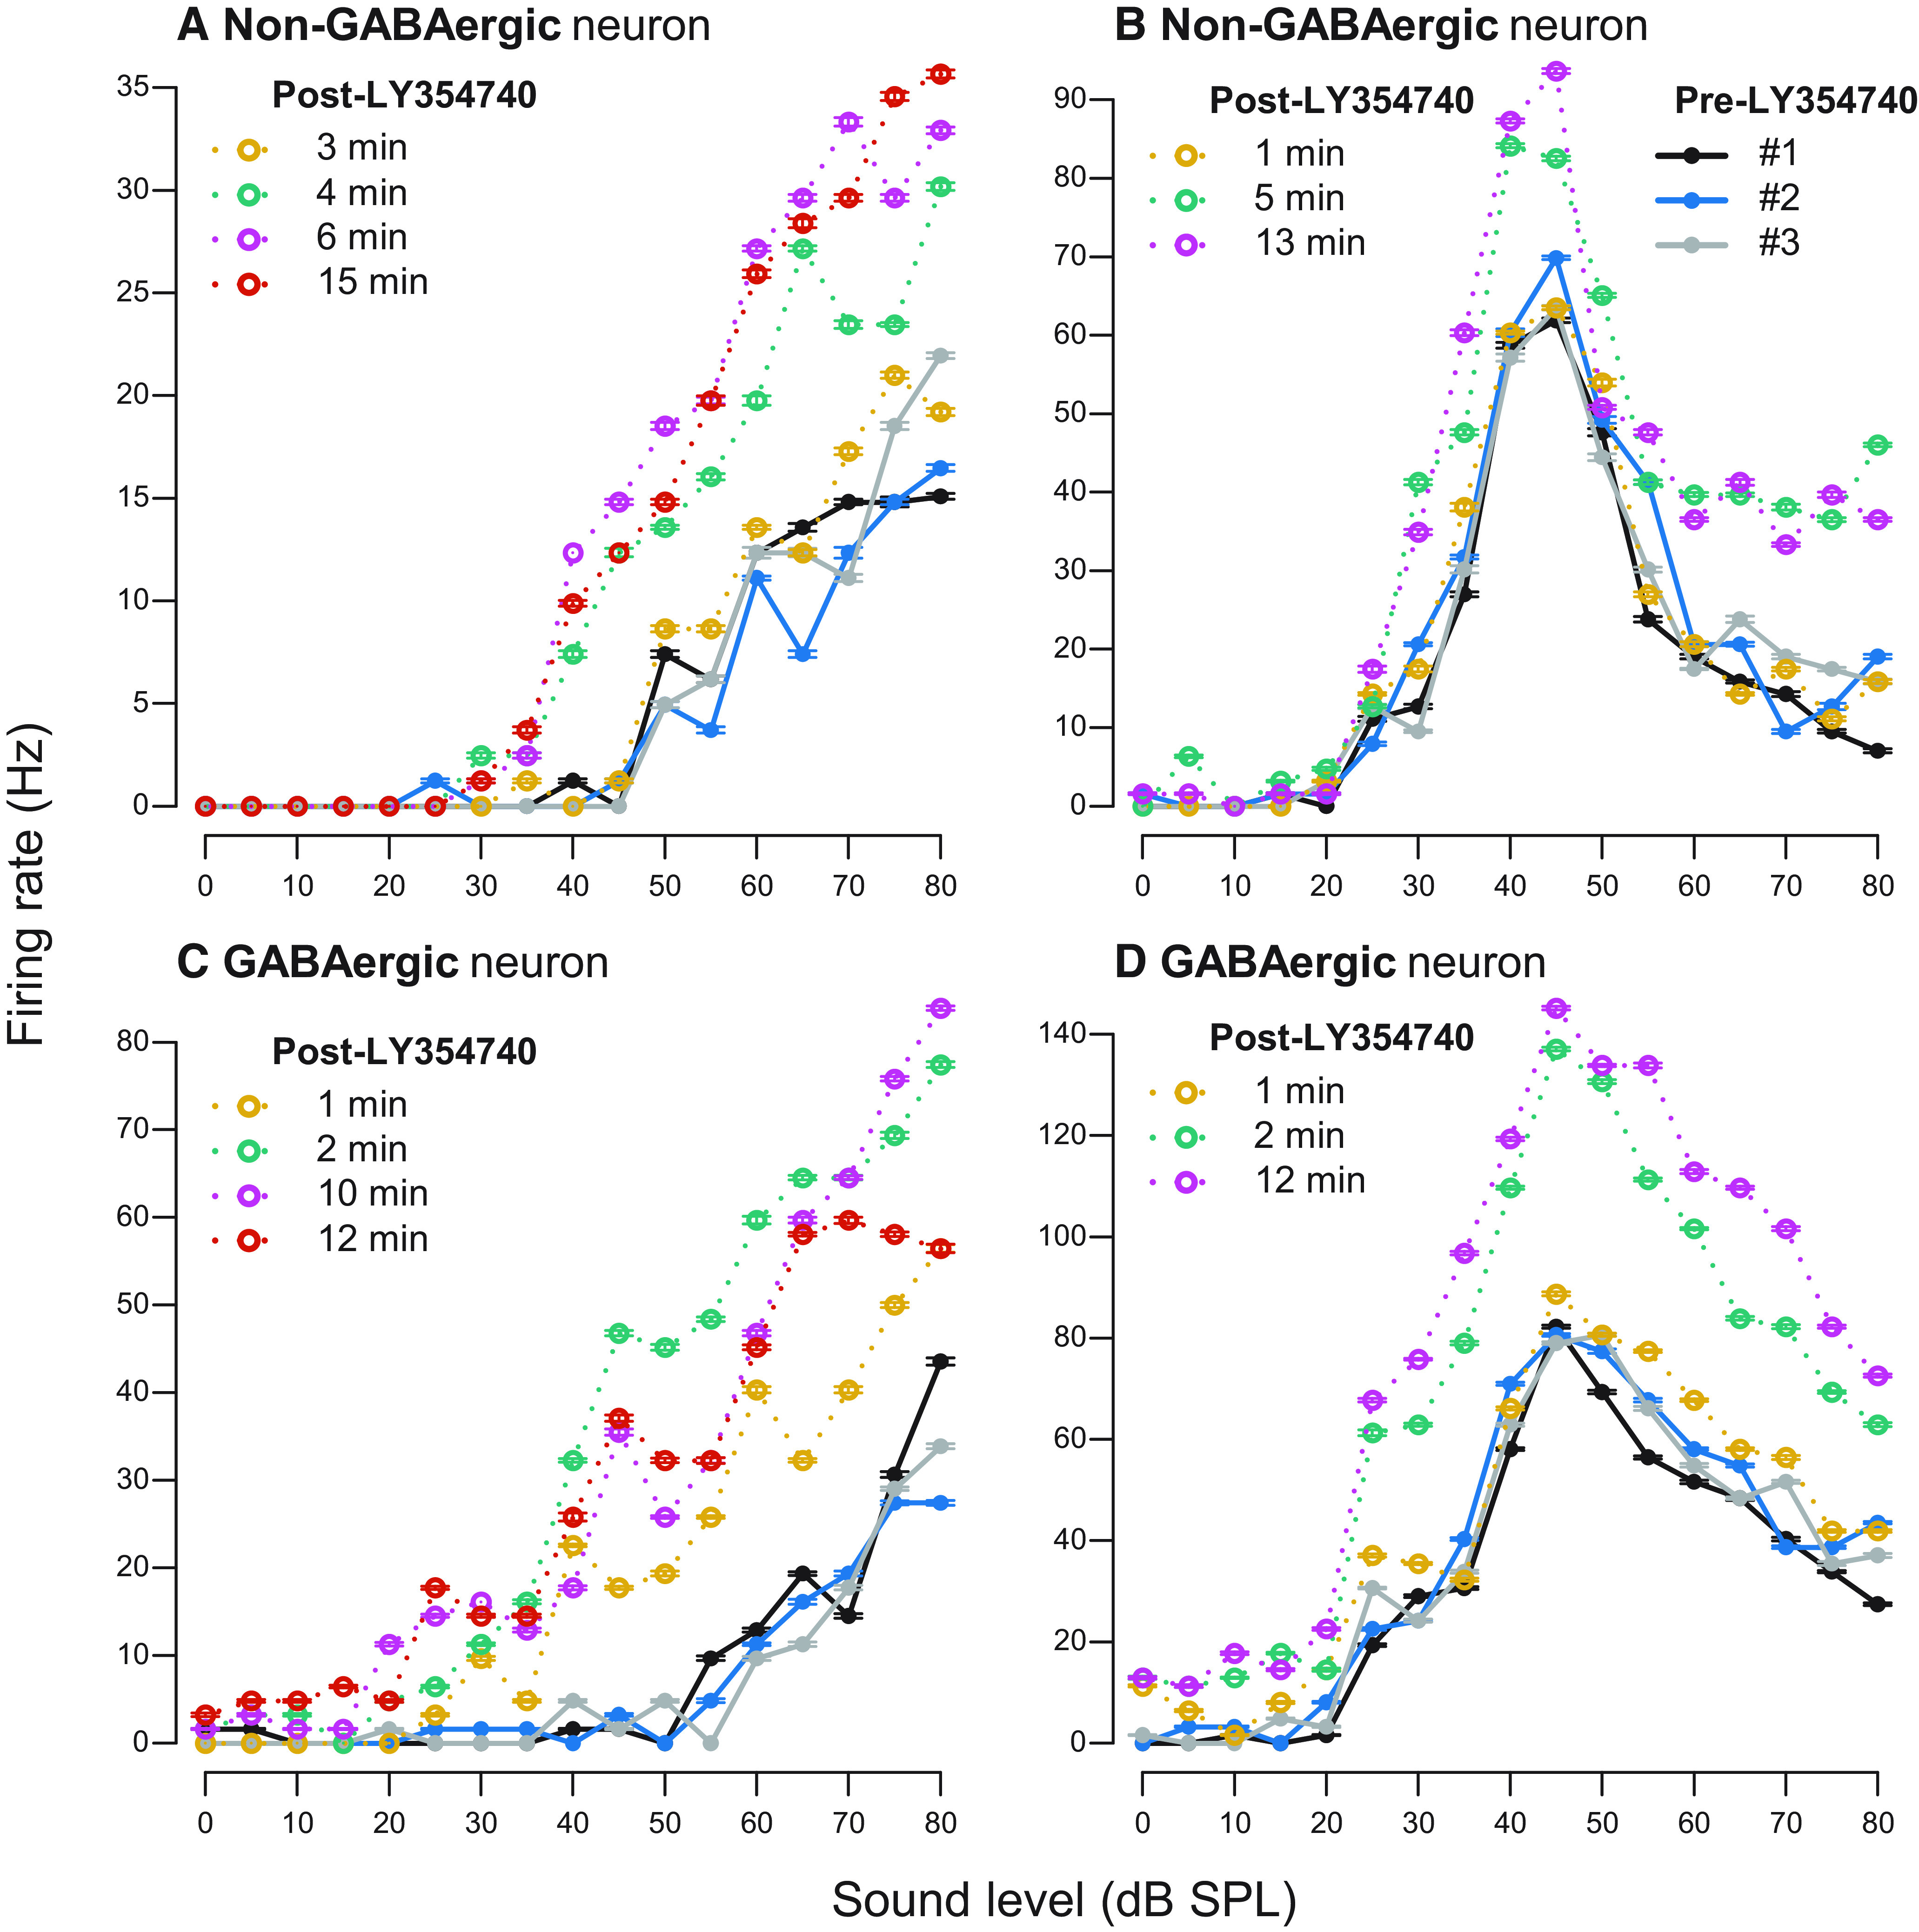
Figure 5.

Examples of RLFs before and after topical LY354740 application. A, B, Non-GABAergic neurons. C, D, GABAergic neurons. Pre-drug RLFs are plotted in solid black, blue, and gray lines in all panels (legend only shown in panel B). Post-drug RLFs are color coded yellow, green, pink, and orange to demonstrate drug effect over time; time after drug application is indicated for each individual RLF. Error bars represent ± SEM of 10 sound stimulus presentations at each sound level.
