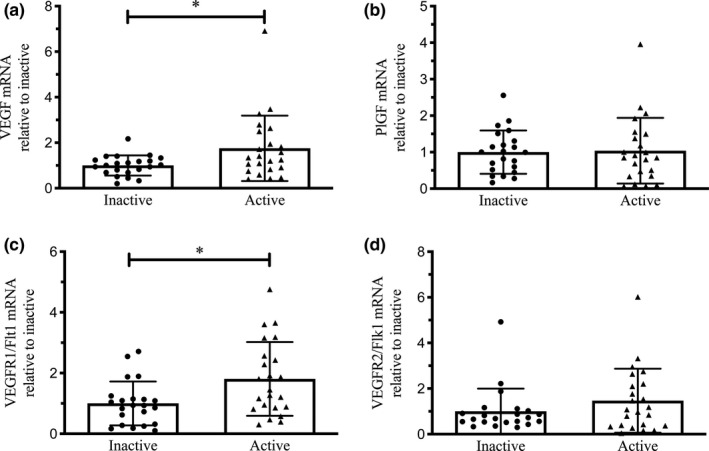
FIGURE 2.

Expression of VEGF, PlGF, VEGFR1 (Flt1), and VEGFR2 (Flk1) mRNA by real‐time PCR in term placenta (2:1 ratio of tissue from the central and peripheral regions of the placenta, respectively) from physically active (n = 23) and inactive (n = 22) women. Relative quantification of mRNA VEGF (a), PlGF (b), VEGFR1 (Flt1) (c) and VEGFR2 (Flk1) (d) expression. Relative expression was normalized to the expression of GAPDH in all samples. All data are represented as mean ± SD. *p < 0.05.
