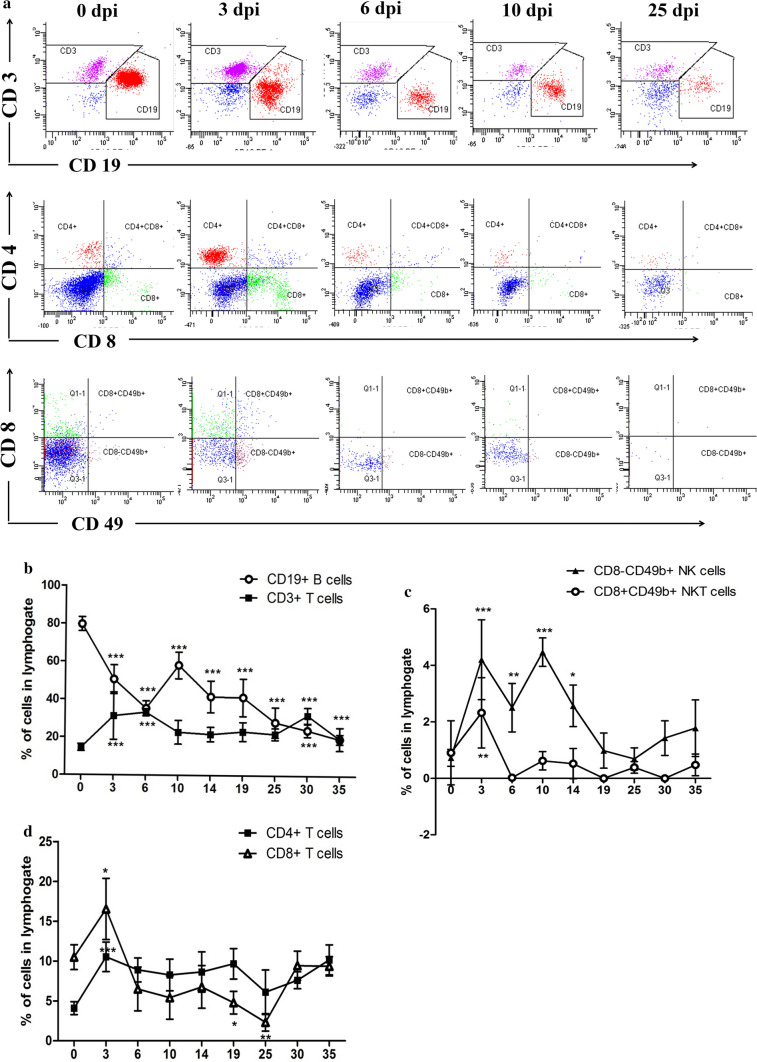
Fig. 1.
Peritoneal lymphocyte cell population in the peritoneal cavities of healthy and Mesocestoides vogae-infected mice at 3, 6, 10, 14, 19, 25, 30 and 35 days post-infection. Peritoneal exudate cells were isolated from the peritoneal cavity, and the expression of lymphocyte surface markers by these cells was analyzed from lymphogate using flow cytometry. a Representative dot plots show the expression of CD3/CD19, CD4/CD8 and CD49b/CD8 on PEC. Proportions of T- and B-lymphocytes (b), T-lymphocyte subpopulations (c), NK and NKT cells (d) in the peritoneal cavities of healthy and infected mice. Data are expressed as the means ± SD. Statistical significance was analyzed using one-way ANOVA with Dunnett's post-test, and significantly different values between control and infected groups are indicated as: *p < 0.05, **p < 0.01, ***p < 0.001.

