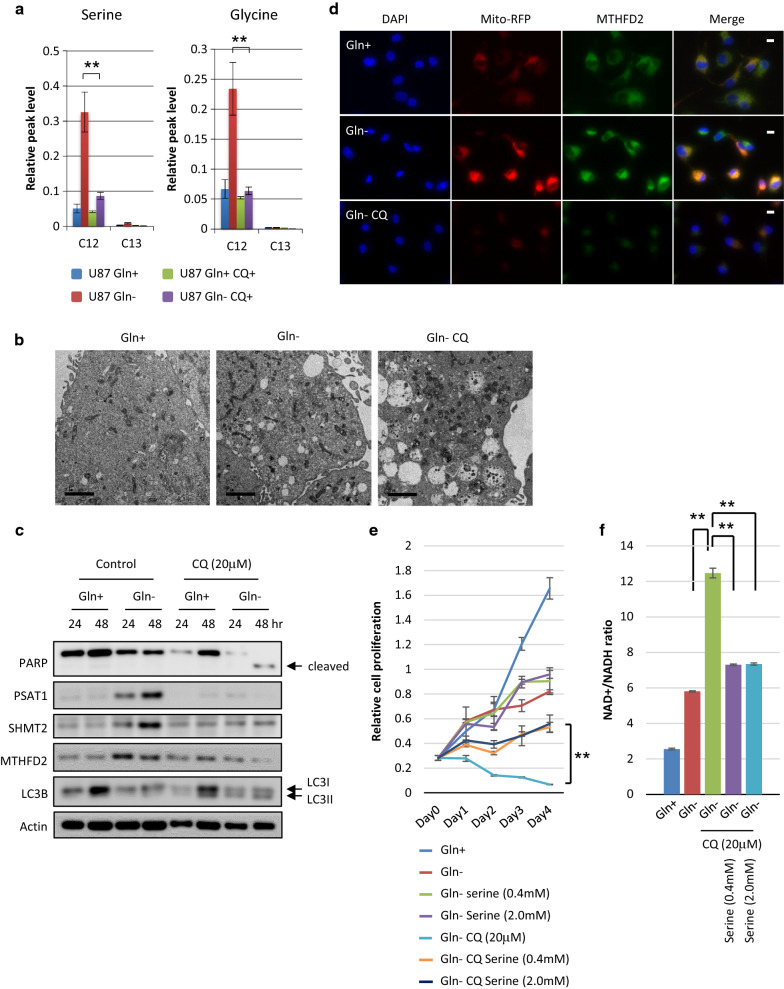
Fig. 5.
Serine is supplied by autophagy of GBM cells to survive glutamine deprivation. See also Additional File 2: Supplemental Fig. 5. a GC–MS analysis of glutamine (Gln) starvation and 20 μM chloroquine (CQ) treatment effect on [U-13C] glucose metabolism to different 13C isotopologues of serine and glycine in U87 GBM cells treated for 24 h. Data represent the mean ± SEM of three independent experiments (statistically significant with **p < 0.01). b Representative transmission electron microscopy images of U87 GBM cells which were grown with or without glutamine (Gln) and treated with chloroquine (CQ) for 24 h. Scale bar: 2 μm c Immunoblot analysis using indicated antibodies of U87 cells which were grown with or without glutamine and treated with chloroquine (CQ) or control DW for 24–48 h. d U87 GBM cells in glutamine-starved and treated with 20 μM chloroquine (CQ) for 24 h. Cells were then fixed, permeabilized and stained for DNA (DAPI), mitochondria (Mito-RFP) and MTHFD2. One representative picture for each condition is shown. Scale bar: 10 μm e U87 GBM cells were grown without glutamine (Gln) and treated with 20 μM chloroquine (CQ) in the presence or absence of 0.4 and 2.0 mM serine. Cell numbers were counted over time. Data represent the mean ± SEM of three independent experiments (statistically significant with **p < 0.01). f NAD +/NADH ratio in U87 cells which were grown with or without glutamine (Gln) treated with 20 μM chloroquine (CQ) or DW in medium containing 0.4 and 2.0 mM serine or not for 48 h. Data represent the mean ± SEM of three independent experiments (statistically significant with **p < 0.01)

