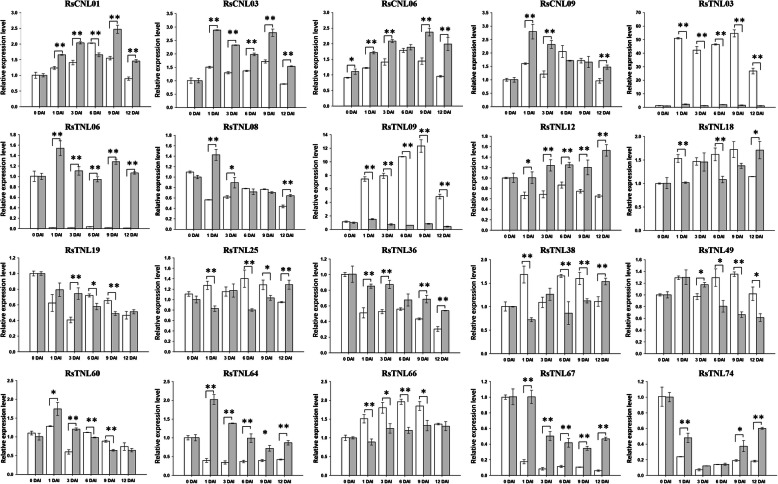
Fig. 8.
Relative expression levels of 4 RsCNL and 16 RsTNL radish genes. The ‘YR4’ (resistant) and ‘YR18’ (susceptible) lines are represented by white and gray bars, respectively. The y-axis represents the relative gene expression levels, whereas the time-points (0, 1, 3, 6, 9, and 12 DAI) are presented on the x-axis. The error bars indicate the standard deviation of three replicates; Asterisks indicate significant differences between the ‘YR4’ and ‘YR18’ lines based on a t-test (independent), ‘*’ indicates P value < 0.05 and > 0.01, and ‘**’ indicates P value < 0.01

