
Table 2.
Risk of bias assessment of the 19 included articles grouped by study population (modified from Hoy et al., 2012)
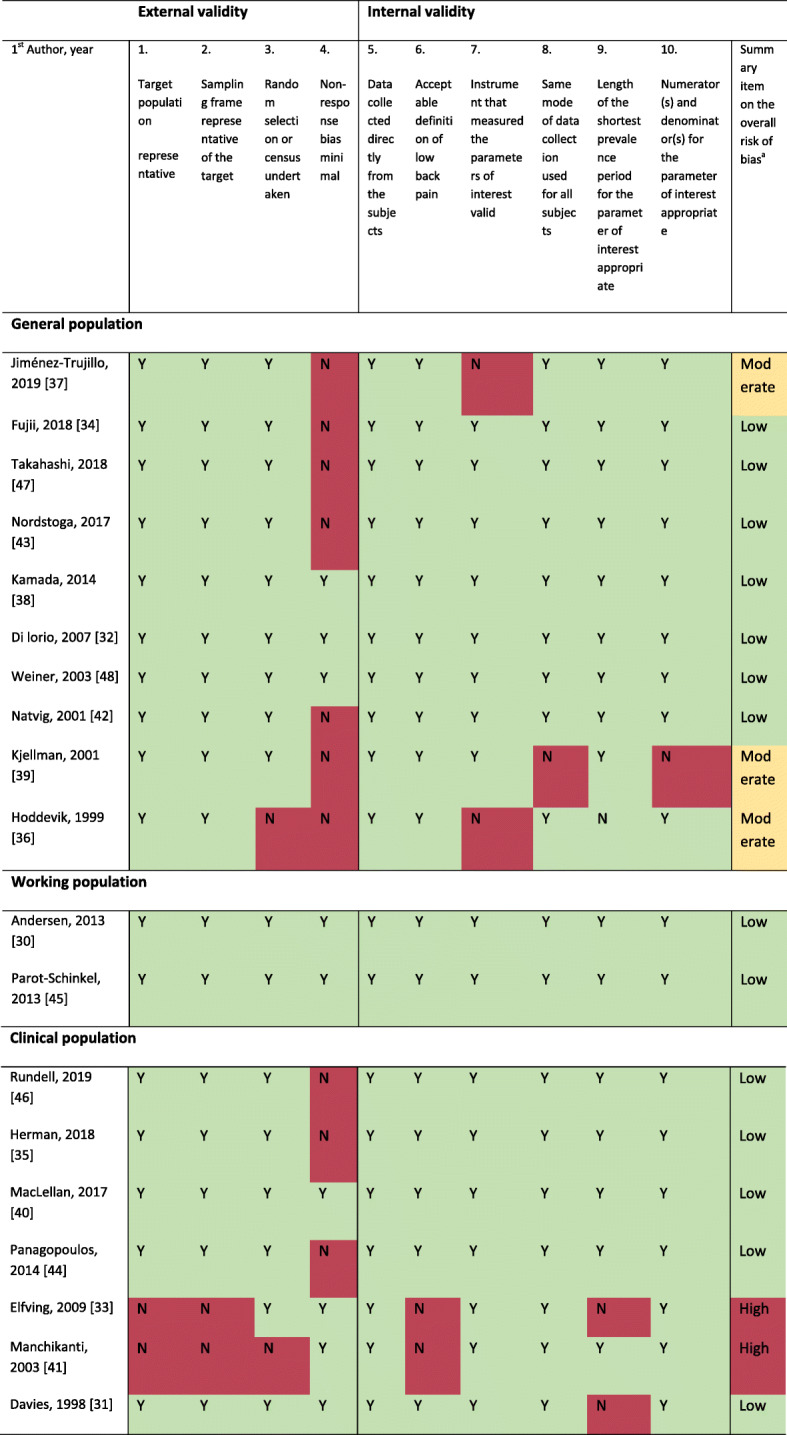
Abbreviations: Y yes (low risk of bias), N no (high risk of bias)
a Summary of overall risk of bias indicated by colour (green = low risk of bias, further research is very unlikely to change our confidence in the estimate; yellow = moderate risk of bias, further research is likely to have an important impact on our confidence in the estimate and may change the estimate; red = high risk of bias, further research is very likely to have an important impact on our confidence in the estimate and is likely to change the estimate).