
FIGURE 8.
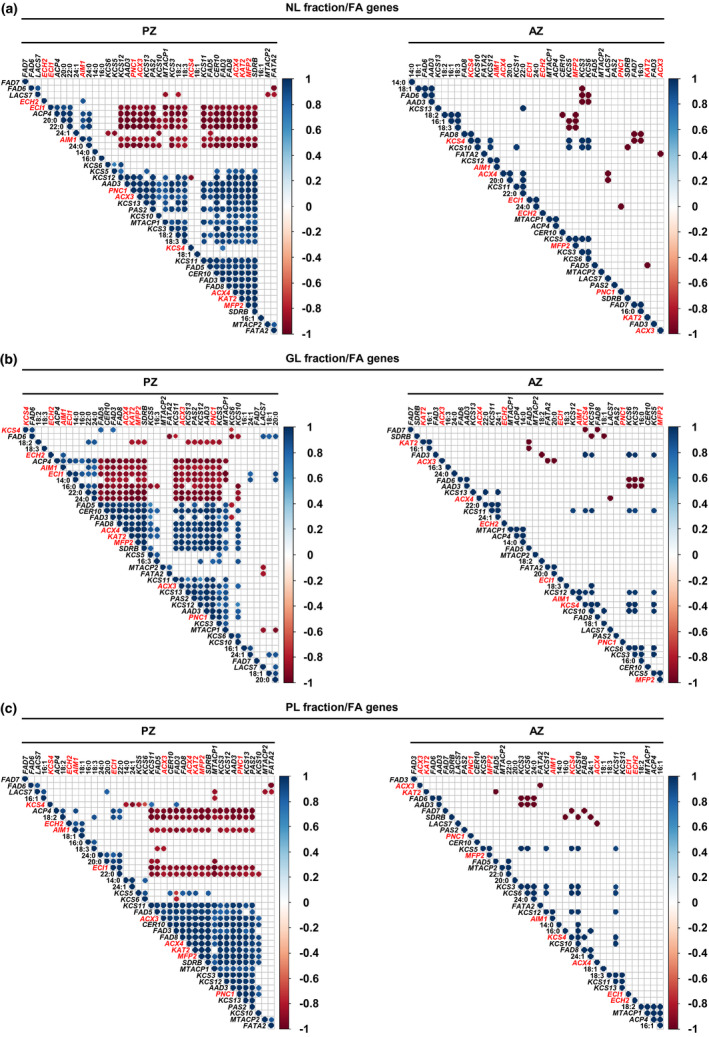
Pearson correlation analysis between gene expression levels of lipid metabolism genes and the amounts of single FAs of the NL, GL, and PL fraction of A. alpina perpetual flowering 1‐1 (pep1‐1) mutant lateral stem internodes of perennial (PZ) and annual (AZ) zones. The analysis was performed between stages III_PZ, IV_PZ, and I′, II′ for PZ and IV_AZ_if and II′ for AZ (see Figures 1 and 5a). Correlation analysis between (a) NL‐derived, (b) GL‐derived, (c) PL‐derived FAs and FA synthesis, elongation, desaturation, and β‐oxidation‐related genes. AAD3, ACYL‐ACYL CARRIER PROTEIN DESATURASE 3, ACP4, ACYL CARRIER PROTEIN 4, ACX3, ACYL‐COA OXIDASE 3, ACX4, ACYL‐COA OXIDASE 4, AIM1, ABNORMAL INFLORESCENCE MERISTEM 1, CER10, ECERIFERUM 10, ECH2, ENOYL‐COA HYDRATASE 2, ECI1, Δ3, Δ2‐ENOYL COA ISOMERASE 1, FAD3, FAD5, FAD6, FAD7, FAD8, FATTY ACID DESATURASEs, FATA2, OLEOYL‐ACYL CARRIER PROTEIN THIOESTERASE 2, KAT2, 3‐KETOACYL‐COA THIOLASE 2, KCS3, KCS4, KCS5, KCS6, KCS10, KCS11, KCS12, KCS13, KCS19, KETOACYL‐COA SYNTHASEs, LACS7, LONG‐CHAIN ACYL‐COA SYNTHETASE 7, MFP2, MULTIFUNCTIONAL PROTEIN 2, MTACP1, MITOCHONDRIAL ACYL CARRIER PROTEIN 1, MTACP2, MITOCHONDRIAL ACYL CARRIER PROTEIN 2, PAS2, PASTICCINO 2, PNC1, PEROXISOMAL ADENINE NUCLEOTIDE CARRIER 1, SDRB, SHORT‐CHAIN DEHYDROGENASE‐REDUCTASE B. Only correlation coefficients with significant levels of correlation (p < .05) are displayed in the diagrams. Candidate genes differentially regulated between PZ and AZ are represented in red