Fig. 1.
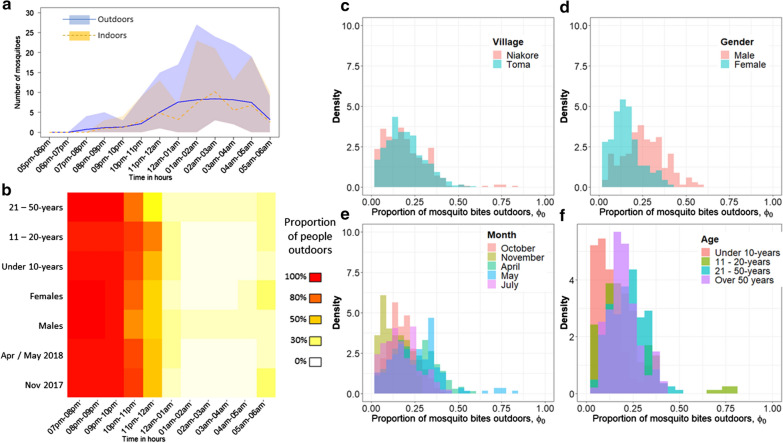
Village-level exploration of mosquito biting risk. a The mean (line) and range (polygon of color) hourly number of Anopheles gambiae s.l. mosquitoes seeking blood meals indoors (orange) or outdoors (blue) measured using human landing catches taken in Niakore in 2016–2017. b The proportion of people who are either outdoors (red) or indoors (white) during the night-time hours as observed using structured observations in Niakore. Cohorts are distinguished by month (sampling nights in Niakore: 10th to 16th November 2017 or April 30th to 6th May 2018), sex (males or females) and age (under 10-years, 11–20-years, or 21–50-years old). The equivalent heat map for Toma is shown in Additional file 1: Fig. S2. Combining these data from both Niakore and Toma, the corresponding range in estimates for the proportion of An. gambiae s.l. mosquito bites received outdoors is shown for villages (Niakore, pink; Toma, blue) (c), sexes (males, pink; females, blue) (d), months (November (gold) and May (blue), Niakore; October (red), April (green) and July (purple), Toma) (e), and age cohorts (under 10-years (red), 11 to 20-years (gold), 21 to 50-years (blue), over 50-years (purple)) (f)

