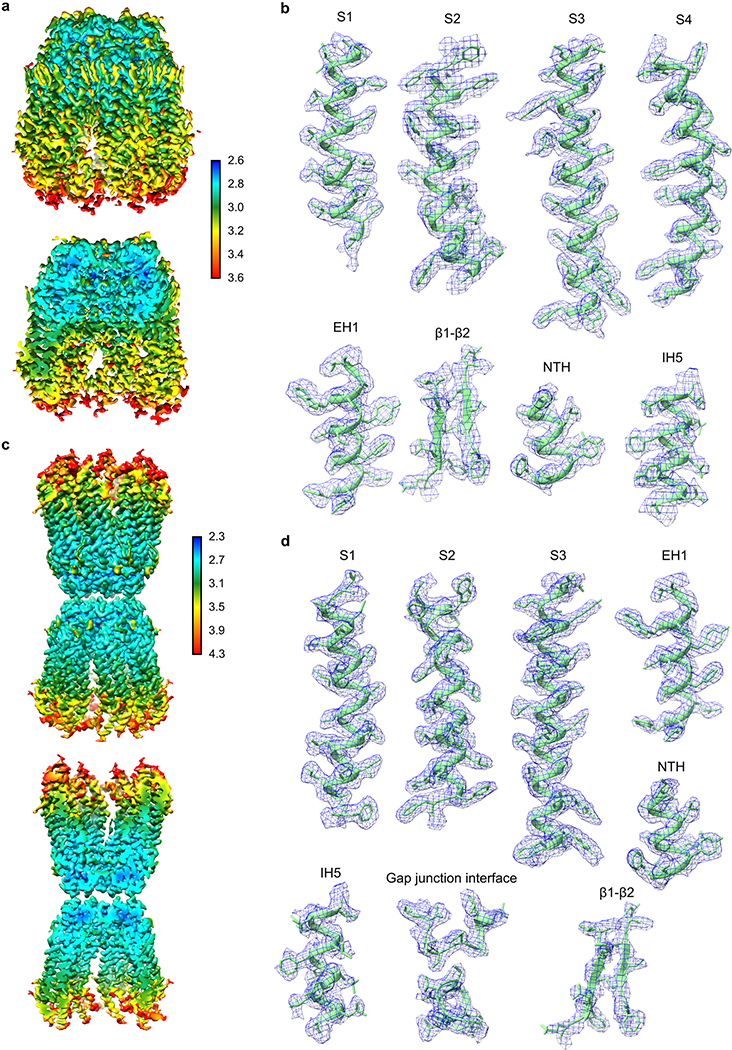
Extended Data Figure 4: Local resolution estimation and representative densities.
a, b, wt-hsPANX1 map. c, d, The N255A-hsPANX1Gap map. To provide better visualization on the exterior and interior map quality, a non-sliced and a sliced view of the maps are shown. The unit for the color bar is in Å. The representative densities were shown for a few selected secondary structure elements of hsPANX1.

