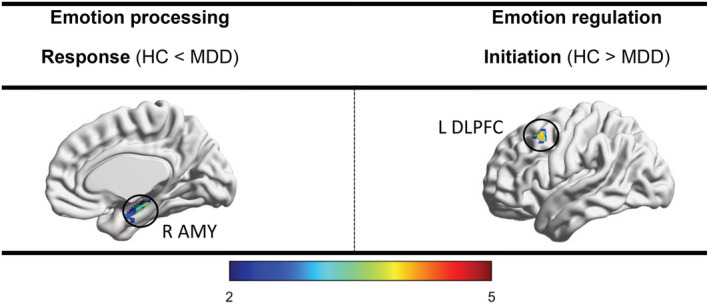
FIGURE 1.

Altered regional amplitude of low frequency fluctuations of emotion processing and regulation seeds in MDD compared with HC group (p < .003, FWE‐ and Bonferroni‐corrected). Major depressive disorder (MDD), healthy control (HC), amygdala (AMY), dorsolateral prefrontal cortex (DLPFC)
