
FIGURE 3.
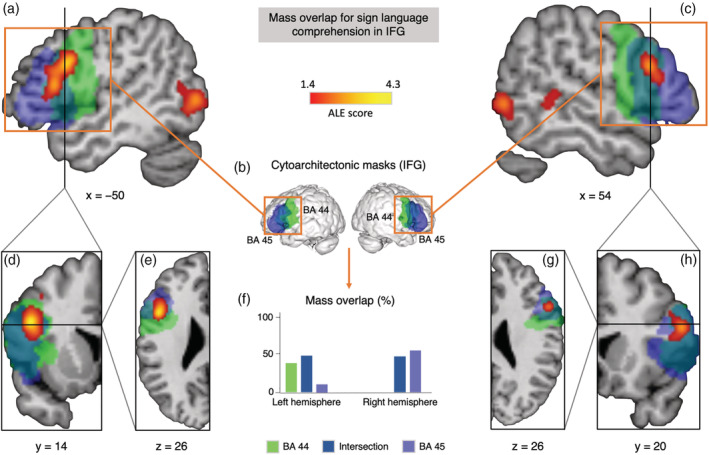
Mass overlap analysis in inferior frontal gyrus (IFG) for convergence map of the activation likelihood estimation (ALE) analysis for sign language (SL) comprehension. (a) Sagittal plane at x = −50 showing the largest cluster (2,336 mm3) in left IFG spanning areas 44 and 45. (b) Cytoarchitectonic maps for areas 44 (green) and 45 (blue) in both hemispheres extracted from the SPM Anatomy Toolbox. (c) Sagittal plane at x = 54 showing the cluster in right IFG constrained to area 45. (d) Coronal plane of the left hemisphere at y = 14. (e) Transverse plane of the left hemisphere at z = 26. (f) Mass overlap of functional clusters with anatomical regions in % of total mass within volume of interest (VOI). (g) Transverse plane of the right hemisphere at z = 26. (h) Coronal plane of the right hemisphere at y = 20