
FIGURE 4.
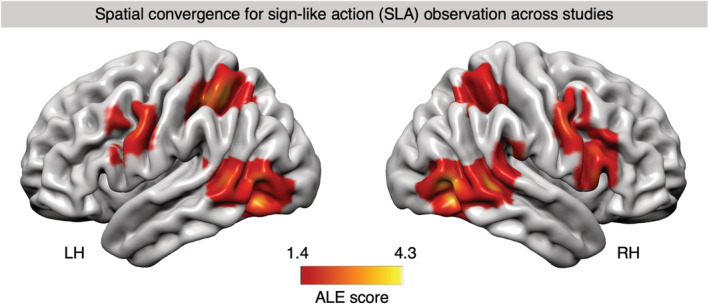
Activation likelihood estimation (ALE) map of significant clusters associated with sign‐like action (SLA) observation, superimposed onto a standard cortical surface of the left and right hemisphere (LH/RH). Convergence mass of the ALE analysis for all “SLA observation > control/baseline” contrasts with above‐chance overlap (p < .05, cluster‐level family‐wise error [cFWE] corrected) is shown. The color bar indicates the ALE score of any given voxel which represents the degree of nonrandom convergence in activation between contrasts in the dataset