FIGURE 10.

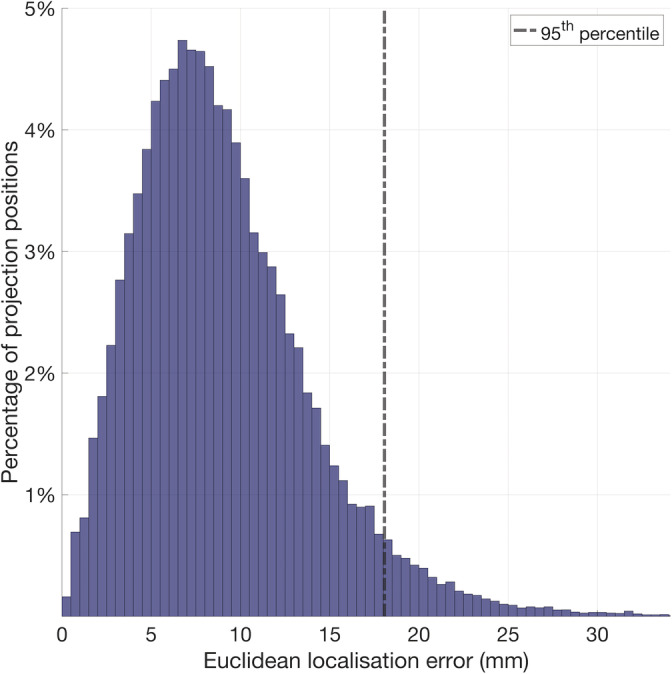
Histogram displaying the distribution of the Euclidean localisation error of each cortical projection position, combining data from each individual

Histogram displaying the distribution of the Euclidean localisation error of each cortical projection position, combining data from each individual