FIGURE 11.

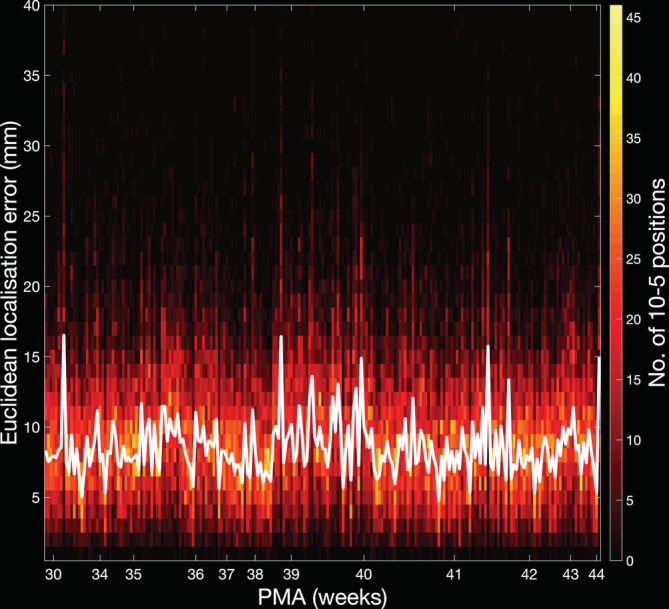
Histogram displaying the distribution of the Euclidean localisation error of the cortical projection positions per individual (see colourbar) and the median values for each individual (plotted as a white line)

Histogram displaying the distribution of the Euclidean localisation error of the cortical projection positions per individual (see colourbar) and the median values for each individual (plotted as a white line)