FIGURE 1.

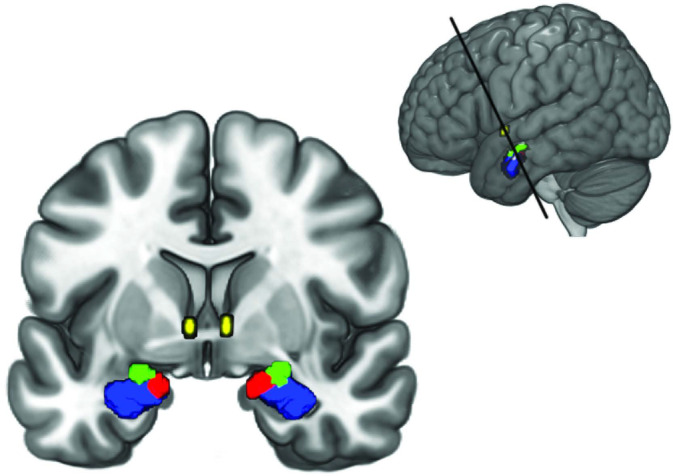
Amygdala nuclei and BNST regions of interest used in this study. The LB is shown in blue, the CM in green, the SF in red and the BNST in yellow. The top right inlay shows the section

Amygdala nuclei and BNST regions of interest used in this study. The LB is shown in blue, the CM in green, the SF in red and the BNST in yellow. The top right inlay shows the section