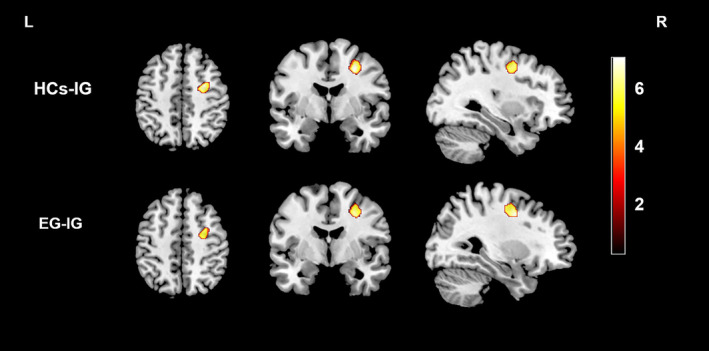
FIGURE 1.

Regions showing differences in GMV between the HC group and IG and between the EG and IG. Compared with participants in the HC group, IG patients exhibited decreased GMV in the right MFG/PreCG. Direct comparison between the EG and IG showed that GMV was reduced in the right MFG/PreCG in IG patients (corrected at the cluster level with FWE p < .05). EG, effective group; FWE, familywise error; GMV, gray matter volume; HCs, healthy controls; IG, ineffective group; MFG, middle frontal gyrus; PreCG, precentral gyrus
