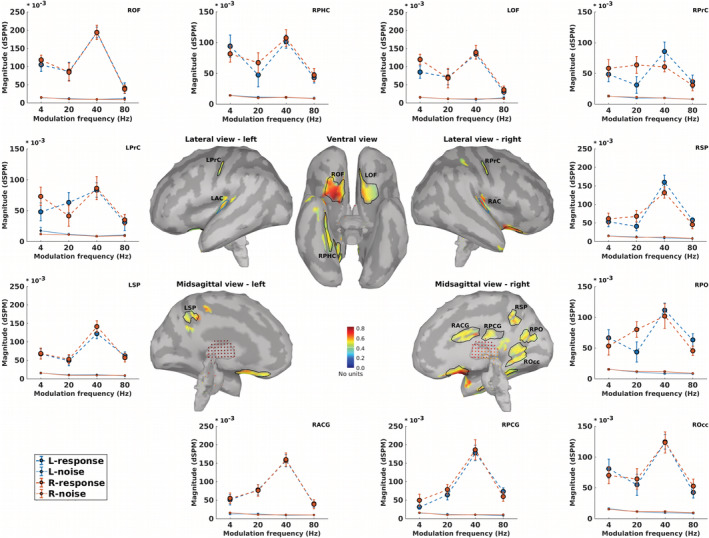
FIGURE 5.

Non‐primary regions of interest (ROIs) and their neural responses. Central panels depict the grand‐averaged SNR maps of different stimulation conditions (4, 20, 40, and 80 Hz amplitude modulated (AM) stimuli presented to the left and the right ears) and the obtained ROIs. The anatomical labels of ROIs are listed in Table 1. Surrounding panels illustrate biased responses (calculated based on Equation (3), dashed lines) and neural background noise (calculated based on Equation (3), dotted lines) of each ROI, in response to AM stimuli with different modulation frequencies presented to the left (blue) and right ears (red). The error bars show the SD estimated by means of the jackknife method (Efron & Stein, 1981)
