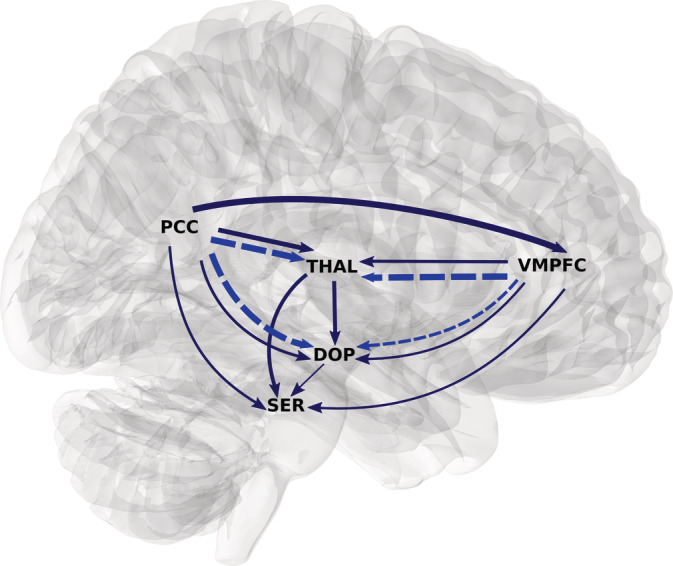
FIGURE 5.

Spectral Granger causality (dark blue solid) and significant phase‐delay (bright blue dotted). Only stronger SGC between the two ROIs is represented. The width of the lines is proportional to the strength of the metric. The SGC is grossly concordant with phase‐delay, that is, the region that Granger cause is that who is also leading in the phase‐delay analysis
