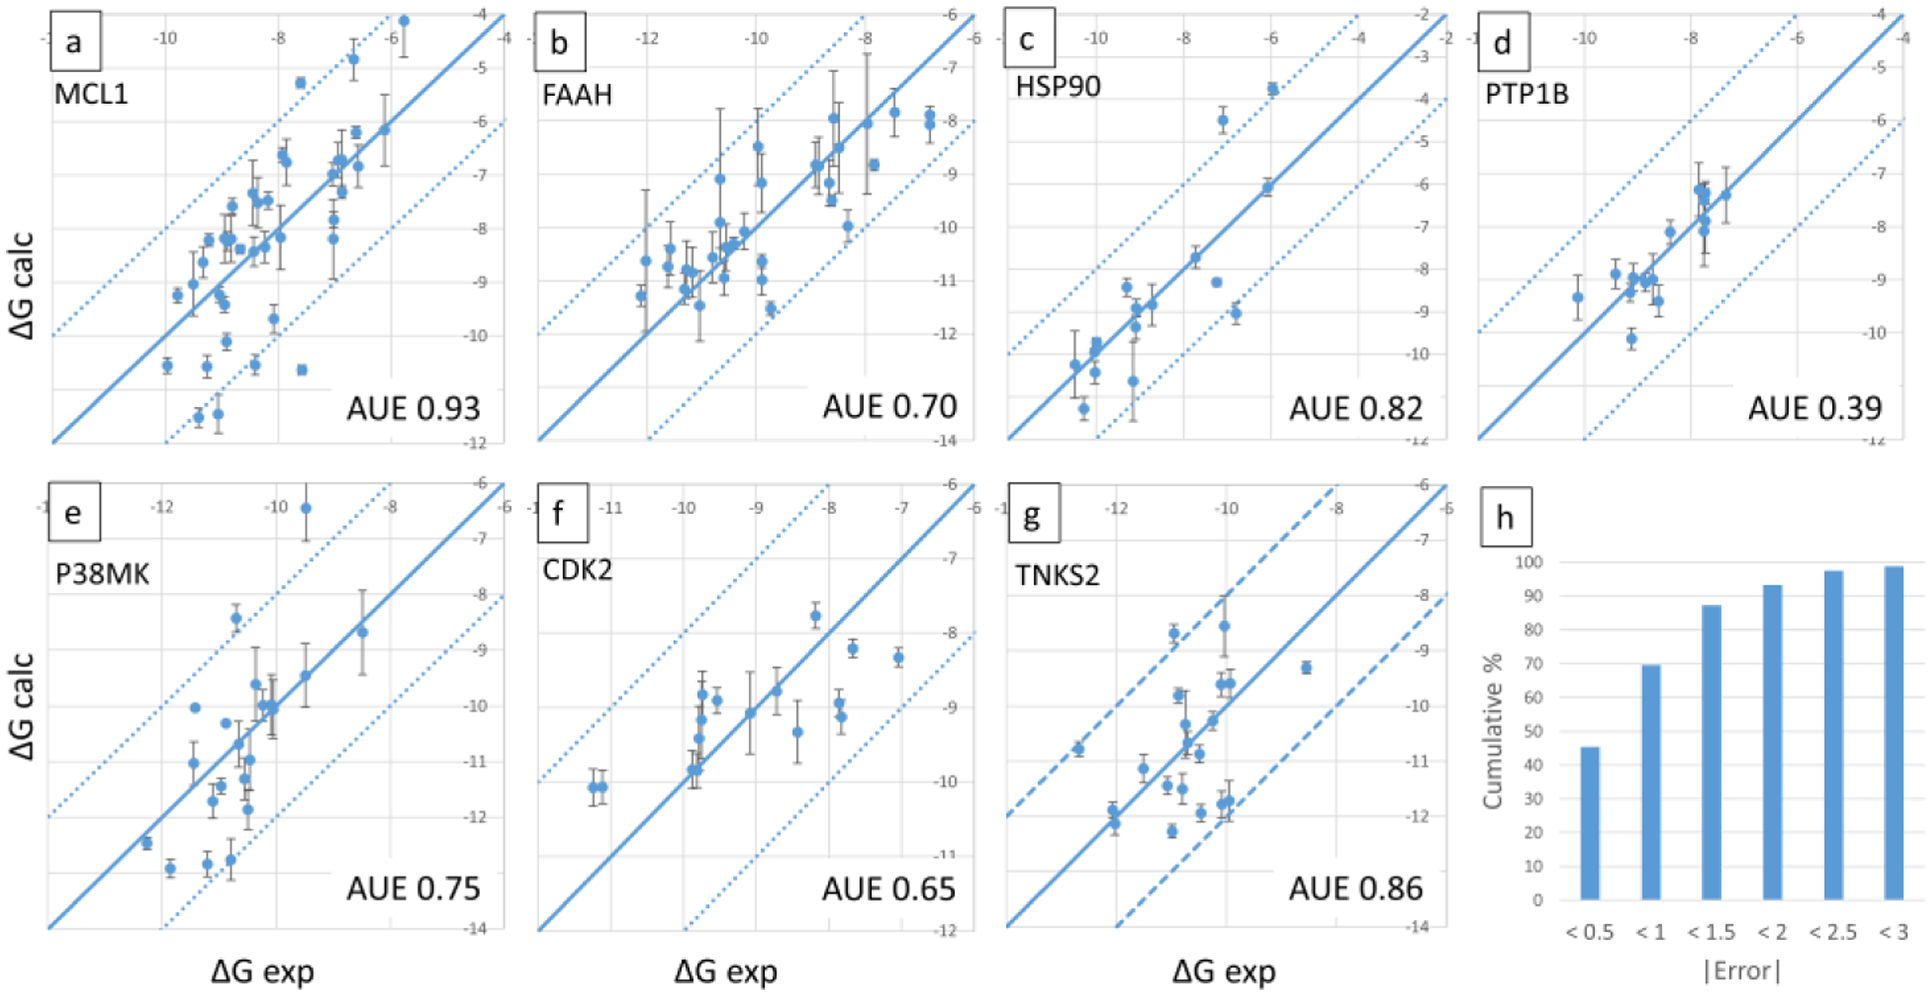
Figure 2.

Calculated vs. experimental absolute binding free energies for the seven datasets are shown in panels a-g, with the name of the protein indicated on top left, and AUE on bottom right. Panel h shows the cumulative percentage of ligands for which absolute errors in predictions are lesser than different error bounds. Calculated relative free energies were converted to absolute by adding a constant offset value that minimizes errors associated with the choice of a single reference ligand as described in Methods. Units are kcal/mol.
