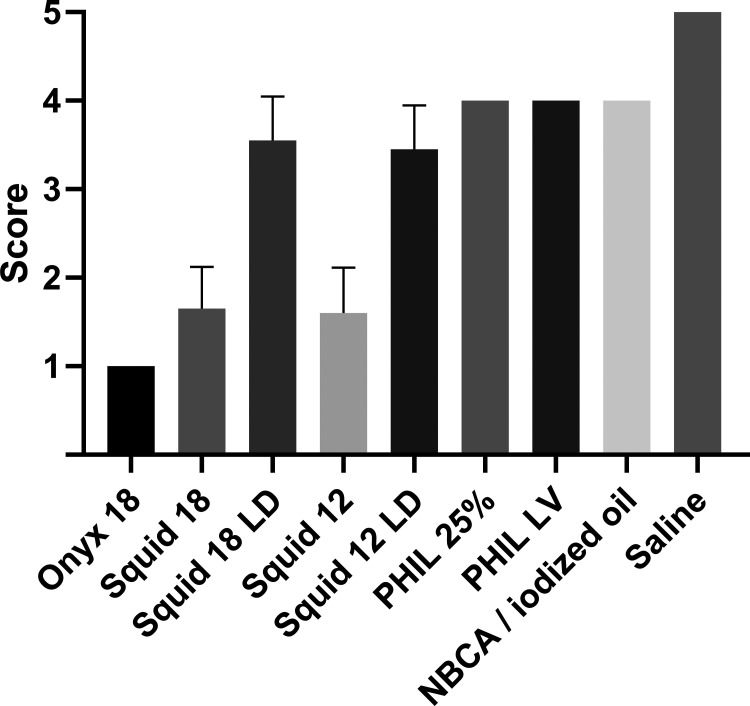
FIG 4.
Illustration of the results of the qualitative image analysis using a 5-point scale. Different degrees of artifacts were observed among all study groups using the Dunn test for multiple comparisons with statistical hypothesis testing. Bars indicate mean; whiskers, SD. Five-point scale: 1) severe artifacts, 2) marked artifacts, 3) moderate artifacts, 4) minor artifacts, and 5) no artifacts.

