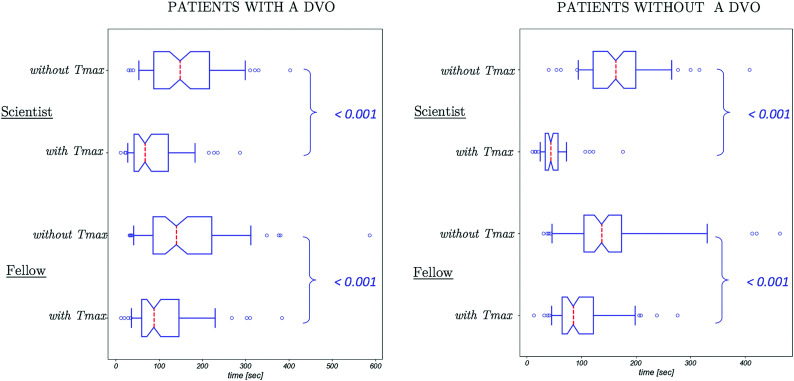
FIG 2.
Box-and-whisker plots of time taken to interpret CTA in patients with and without a DVO on the reference standard. The dashed red line indicates median time; the upper and lower edges of the boxes indicate the first and third quartiles, respectively; the notches represent the 95% confidence intervals of the median; and the whiskers extend to the fifth and 95th centiles. Outliers are shown in the circles. For both readers, interpretation was significantly faster (P < .001) with Tmax than without it. The spread of times also decreased with Tmax.

