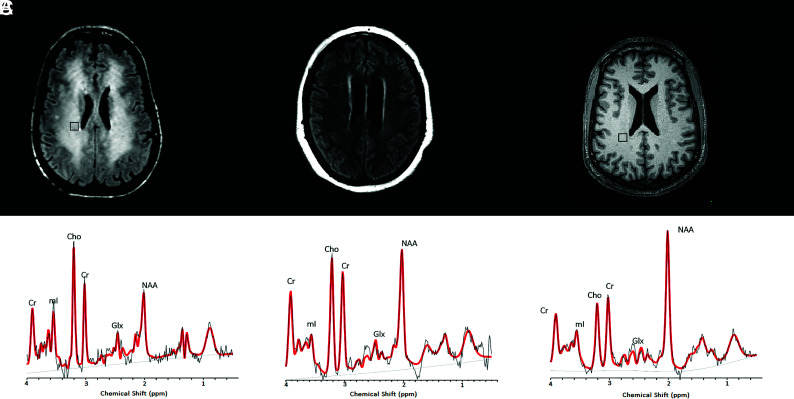
FIG 2.
1H-MR spectra from 2 non-COVID leukoencephalopathy patients, compared with a spectrum from a healthy control patient. Upper row: Axial noncontrast FLAIR (A and B) and T1-weighted (C) images at the level of the corona radiata show representative MRS voxels (black squares) from sampled periventricular regions. Lower row: Corresponding spectrum (black) and LCModel fit (red) from each patient acquired at TE = 30 ms. A, A patient with delayed posthypoxic/toxic leukoencephalopathy shows an increase of Cho/Cr and decreased NAA/Cr ratios. B, A patient with sepsis-associated encephalopathy shows milder degrees of Cho/Cr elevation and NAA/Cr reduction. C, A healthy control subject with a normal MR spectrum. Cho, Choline; NAA, N-Acetyl-Aspartate; mI, Myo-Inositol; Lac, Lactate; Glx, Glutamate + Glutamine.

