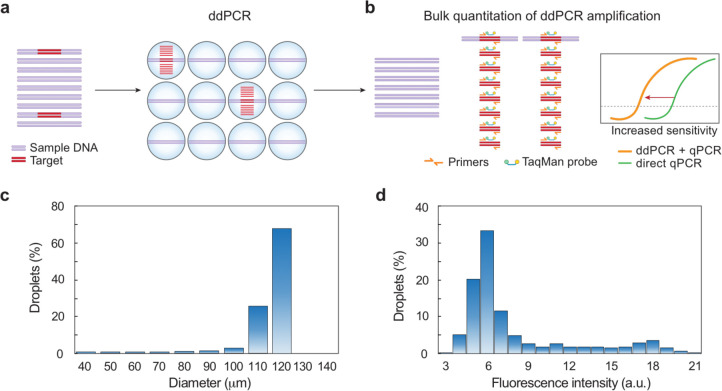
Fig.1.
Schematic of workflow for bulk quantitation of ddPCR. (a) A mixed DNA sample is emulsified and processed for ddPCR. The target molecules are amplified in individual droplets. (b) The number of target molecules in the starting sample is proportional to the amount of amplification products, which are quantified by bulk measurement. qPCR quantification of the ddPCR products shows enhanced sensitivity compared to direct qPCR by elevating the qPCR signal. (c) Size distribution of microfluidic emulsions (n = 950) shows microfluidics generates monodispersed emulsions. (d) Fluorescence intensity distribution of microfluidic emulsions (n = 540) indicates that the assay has nonzero background.

