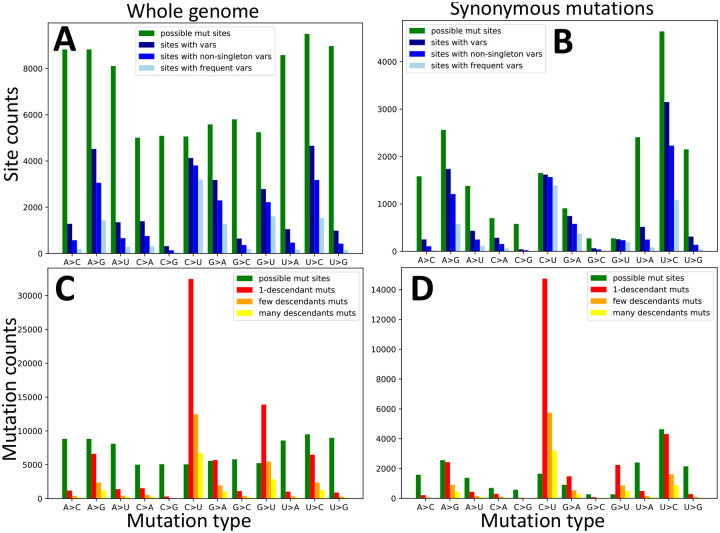
Figure 1: Numbers of possible mutations, observed mutations, and sites with alternative alleles.
On the X axes are the 12 distinct types of mutation events, A→C, A→G, etc. In green we always show the number of genome positions at which the considered mutation type is possible. In A,C we consider all possible mutations, while in B,D we consider only synonymous mutations. In A,B we show, on the Y axis, the numbers of sites with alternative alleles in the alignment (blue color hues). In dark blue we show the number of all sites with alternative variants of the given type; in blue, we only show the number of such sites at which the alternative variant is present in at least 2 sequences; in light blue, only sites at which the considered alternative allele is present in at least 5 sequences. By definition, in plots A-B green bars are necessarily taller than all blue ones. In C-D we show, in red, orange and yellow, the numbers of mutation events inferred with parsimony on our phylogeny. In red we show the number of mutation events of the considered type with exactly one descendant; in orange the number of these mutations with at least 2 but less than 5 descendants; in yellow, those with at least 5 descendants. Mutation possibilities (green) can be fewer than inferred mutations events (red, orange and yellow in plots C-D) for certain types of mutations since the same mutation event can be inferred multiple times at the same site in different parts of the phylogenetic tree.

