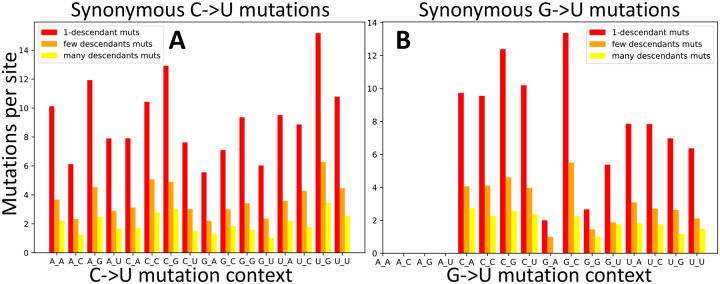
Figure 4: C→U and G→U synonymous mutation rates in different base contexts.
Here mutation rate are calculated as in Figure 3A. A C→U mutations. B G→U mutations. The X axis shows the context of the considered mutation (for example, in A, A_G represents the trinucleotide ACG and its synonymous mutation rate into trinucleotide AUG). Colors are as in Figure 3.

