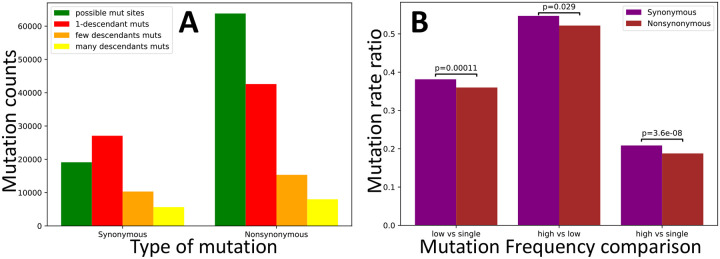
Figure 5: Evidence of selection affecting the population frequency of synonymous vs nonsynonymous mutations.
Counts and rate ratios of SARS-CoV-2 synonymous and non-synonymous mutations at different frequencies in the human population. A counts of possible mutations (green), singleton mutations (red), low frequency (> 1 and ≤ 4 descendants) mutations (orange), and high frequency (> 4 descendants) mutations (yellow). B ratios of higher vs. lower frequency mutation rates. In the absence of selection, ratios should not be significantly different between the classes of synonymous and nonsynonymous mutations. Instead, we measure a significant deviation in each comparison, with nonsynonymous mutations being relatively depleted of high frequency mutations. We calculated p-values using the chi2_contingency function of the Scipy.stats package [36].

