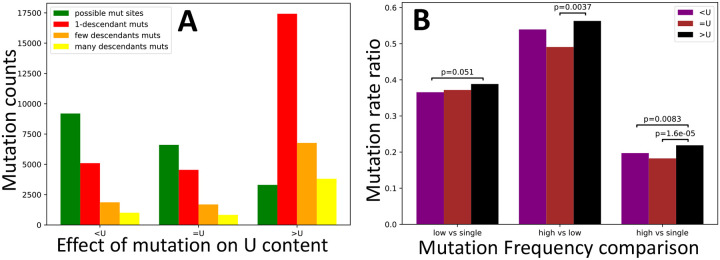
Figure 6: Test of selection affecting U content at synonymous sites.
Values are the same as in Figure 5, but this time we focus on synonymous mutations that decrease U content (“<U”), increase it (“>U”), or leave it unaltered (“=U”). Only p-values below 0.1 are shown.

