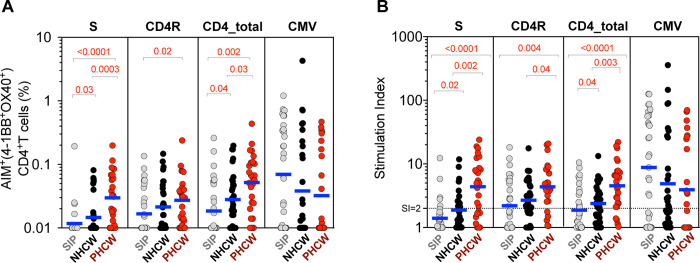
Figure 4. CD4+ T cell response to SARS-CoV-2 epitopes highest in PHCW and lowest in SIP.
SARS-CoV-2-specific CD4+ T cells were measured as percentage of AIM+ (OX40+CD137+) CD4+ T cells after stimulation of PBMCs with peptide pools encompassing spike (“S”) or representing all the proteome without spike (“CD4R”). Graphs show data for specific responses against S, CD4R or the combination of both (CD4-total) and against CMV as a control, and plotted as (A) background subtracted or (B) as stimulation index (SI) against DMSO negative control. Geometric mean for the 3 different groups is shown. Non-parametric Kruskal-Wallis multiple comparison test was applied. P values are shown for the statistical significant comparisons. “SIP” = Shelter In Place community volunteers (n=33). “NHCW” = SeroNegative Health Care Workers (n=31). “PHCW” = Antibody or PCR Positive Health Care Workers (n=26).

